Income Statement, Balance Sheet and Cash Flow
G
GeoRenus Editorial Team
622 views
Summary
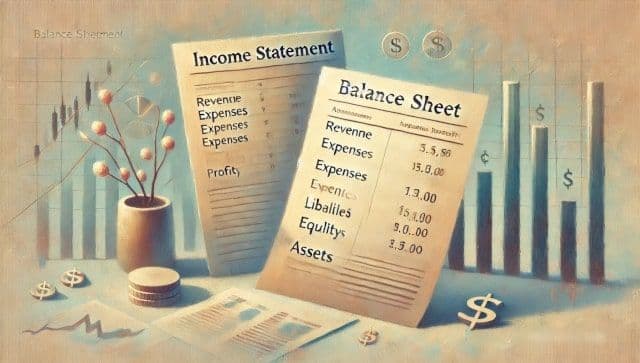
The three core financial statements every business relies on are the income statement, balance sheet, and cash flow statement. The income statement tracks revenue and expenses over a specific period to show whether a company made a profit or loss. The balance sheet provides a snapshot of what a company owns (assets), what it owes (liabilities), and what belongs to shareholders (equity) at a single point in time. The cash flow statement tracks actual money coming in and going out, broken down into operating, investing, and financing activities — because profit on paper does not always mean cash in the bank.
Key Takeaways
- The income statement shows revenue earned and expenses incurred over a specific period — quarterly or annually — and the resulting net income or net loss.
- The balance sheet is a point-in-time snapshot that follows the fundamental equation: Assets = Liabilities + Stockholders' Equity.
- The cash flow statement tracks actual cash movements through three channels: operating activities, investing activities, and financing activities.
- Book value (reported on the balance sheet) often differs from market value because assets are recorded at historical cost minus depreciation, not at what they could sell for today.
- A company can report strong net income on its income statement yet still face cash shortages — which is exactly why the cash flow statement exists as a separate report.
What Are Financial Statements?
Imagine you run a small bakery. Every morning you buy flour, sugar, and butter. Every evening you count the cash in the register. At the end of the month, you sit down and ask yourself three simple questions: Did I make money? What do I own and owe right now? And where did all the cash actually go?
Those three questions are exactly what the three core financial statements answer — the income statement, the balance sheet, and the cash flow statement. Whether you're managing a neighborhood bakery or analyzing a Fortune 500 company, these documents tell the complete financial story of any business.
Warren Buffett once put it this way: "Accounting is the language of business." And financial statements are the sentences written in that language. If you can read them, you can understand almost any company on the planet.
In this guide, we'll break down each statement in plain English, walk through real numbers, and show you how they connect to give you the full picture. No accounting degree required.
The Income Statement: Your Profit and Loss Report
The income statement — also called the profit and loss statement (P&L) — answers one fundamental question: did the company make money or lose money over a specific period? That period could be a month, a quarter, or a full year.
Think of it like your bakery's monthly scorecard. You add up everything you earned, subtract everything you spent, and the number at the bottom tells you whether you came out ahead or fell behind. The income statement has four main components: revenue, expenses, gains, and losses.
Revenue: The Top Line
Revenue is the money a company earns from its core business operations — selling products or providing services. It sits at the very top of the income statement, which is why people call it the "top line."
For Apple, revenue comes from selling iPhones, MacBooks, and services like iCloud. For a law firm, it's the fees charged to clients. For our bakery, it's every loaf of bread and croissant sold over the counter.
Revenue can be broken down further:
- Product Revenue: Income from selling physical goods — a car manufacturer selling vehicles or a clothing retailer selling shirts
- Service Revenue: Income from providing services — consulting fees, subscription charges, or maintenance contracts
- Recurring Revenue: Predictable income streams like monthly subscriptions or annual licensing fees
Here's an important distinction: revenue is recognized when it's earned, not necessarily when cash is received. If your bakery delivers $5,000 worth of wedding cakes in March but the clients pay in April, the revenue is recorded in March. This is called accrual accounting, and it's the standard for most businesses.
Expenses: The Cost of Doing Business
Expenses are the costs a company incurs during its normal business operations to generate revenue. They're subtracted from revenue to determine profit. The major categories include:
- Cost of Goods Sold (COGS): The direct cost of producing what you sell — raw materials, manufacturing labor, and factory overhead
- Operating Expenses: Rent, utilities, salaries, marketing, insurance, and office supplies
- Depreciation and Amortization: The gradual write-off of long-term assets like equipment and patents
- Interest Expense: The cost of borrowing money — interest paid on loans or bonds
Let's say our bakery has these monthly expenses: $3,000 in ingredients (COGS), $2,500 in employee salaries, $1,200 in rent, $300 in utilities, and $200 in insurance. That's $7,200 in total monthly expenses. Every dollar of expense eats directly into profit.
Gains: The Unexpected Wins
Gains are increases in the company's financial position from activities outside of its core operations. They're the pleasant surprises on the income statement.
Common examples include:
- Selling a piece of equipment for more than its book value — if the bakery sells its old oven (book value $2,000) for $3,500, the $1,500 difference is a gain
- Investment returns — interest earned on bank deposits or profit from selling stocks
- Foreign currency gains — when exchange rate fluctuations work in the company's favor
- Insurance settlements that exceed the loss incurred
Gains are reported separately from revenue because they don't come from the company's core business. Investors pay close attention to this distinction because a company that relies heavily on gains rather than revenue may not have a sustainable business model.
Losses: When Things Don't Go as Planned
Losses are the opposite of gains — they represent decreases in the company's financial position from non-core activities. Importantly, losses are different from expenses. Expenses are planned and necessary costs of running the business. Losses are typically unexpected or non-recurring.
Examples of losses include:
- Selling an asset below its book value — selling a delivery van worth $15,000 on the books for only $10,000 creates a $5,000 loss
- Writing off bad debts — customers who received goods but never paid
- Lawsuit settlements and legal penalties
- Losses from natural disasters or fire damage not covered by insurance
Peter Lynch, the legendary mutual fund manager, once noted: "Know what you own, and know why you own it." Understanding the difference between operating expenses and non-recurring losses helps you know exactly what's happening inside a business.
Putting It Together: A Practical Income Statement Example
Let's build a simplified annual income statement for our bakery, Sweet Rise:
- Total Revenue: $180,000
- Cost of Goods Sold (COGS): $54,000
- Gross Profit: $126,000
Now subtract operating expenses:
- Salaries: $30,000
- Rent: $14,400
- Utilities: $3,600
- Insurance: $2,400
- Marketing: $6,000
- Depreciation: $4,000
- Total Operating Expenses: $60,400
Operating Income: $126,000 - $60,400 = $65,600
Now add gains and subtract losses:
- Gain on sale of old oven: +$1,500
- Loss on bad debt write-off: -$2,000
- Interest expense on bakery loan: -$3,600
Income Before Tax: $65,600 + $1,500 - $2,000 - $3,600 = $61,500
Assuming a 25% tax rate: Tax = $15,375
Net Income (the bottom line): $61,500 - $15,375 = $46,125
That $46,125 is what the bakery actually earned after all costs, gains, losses, and taxes. This is the famous "bottom line" — the single most important number investors and business owners look at on the income statement.
The Balance Sheet: A Financial Snapshot
While the income statement covers a period of time (like a full year), the balance sheet is a snapshot taken at a single moment. It answers: what does the company own, what does it owe, and what's left over for the owners? Think of it as a photograph of the business's financial health on one specific date — say, December 31, 2024.
The balance sheet is built on the most fundamental equation in all of accounting:
Assets = Liabilities + Stockholders' Equity
This equation must always balance — hence the name "balance sheet." Every dollar a company has (assets) was either borrowed (liabilities) or invested by owners (equity). There are no exceptions.
Assets: What the Company Owns
Assets are resources that have economic value and can generate future benefits. They're divided into two categories:
Current Assets — expected to be converted to cash or used within one year:
- Cash and cash equivalents: Money in bank accounts and short-term investments
- Accounts receivable: Money customers owe you for goods or services already delivered
- Inventory: Raw materials, work-in-progress, and finished goods ready for sale
- Prepaid expenses: Bills you've paid in advance, like insurance premiums
Non-Current Assets — long-term resources that provide value for more than one year:
- Property, Plant, and Equipment (PP&E): Buildings, machinery, vehicles, and land
- Intangible Assets: Patents, trademarks, copyrights, and goodwill
- Long-term Investments: Stocks, bonds, or real estate held for more than a year
For our bakery, current assets might include $12,000 in cash, $3,000 in accounts receivable (from a catering order), and $5,000 in ingredient inventory. Non-current assets might include a $40,000 commercial oven and $25,000 in leasehold improvements.
Liabilities: What the Company Owes
Liabilities are the company's obligations — debts and other amounts it must pay. Like assets, they're classified by time horizon:
Current Liabilities — due within one year:
- Accounts payable: Money owed to suppliers for goods and services received
- Short-term loans: Bank loans and credit lines due within 12 months
- Accrued expenses: Wages, taxes, and utilities that have been incurred but not yet paid
- Unearned revenue: Cash received for goods or services not yet delivered
Long-Term Liabilities — due beyond one year:
- Long-term bank loans and mortgages
- Bonds payable issued to investors
- Lease obligations extending beyond 12 months
- Pension liabilities owed to retired employees
Stockholders' Equity: What Belongs to the Owners
Equity is what's left after you subtract liabilities from assets. It represents the owners' claim on the business. The main components are:
- Common Stock: The par value of shares issued to investors
- Additional Paid-In Capital: The amount investors paid above par value when buying shares
- Retained Earnings: Cumulative profits the company has kept instead of distributing as dividends — this is the bridge between the income statement and the balance sheet
- Treasury Stock: Shares the company has bought back from the market, which reduce total equity
Book Value vs. Market Value
Here's something that trips up many beginners. The balance sheet reports assets at their book value — which is historical cost minus accumulated depreciation. But the actual market value of those assets could be very different.
Suppose our bakery bought its commercial oven for $40,000 five years ago. With annual depreciation of $4,000, the book value is now $20,000. But if similar ovens sell for $28,000 on the used market, the market value exceeds the book value by $8,000. The balance sheet only shows the $20,000 figure.
This matters enormously for investors. As of 2024, Apple's book value was roughly $74 billion, but its market capitalization exceeded $3 trillion — a staggering 40x difference. That gap reflects intangible value like brand strength, ecosystem lock-in, and future earnings potential that the balance sheet simply cannot capture.
Balance Sheet Example: Sweet Rise Bakery
Here's what our bakery's balance sheet might look like on December 31:
Assets:
- Cash: $12,000
- Accounts Receivable: $3,000
- Inventory: $5,000
- Equipment (net of depreciation): $20,000
- Leasehold Improvements: $25,000
- Total Assets: $65,000
Liabilities:
- Accounts Payable: $4,000
- Short-term Loan: $6,000
- Long-term Bakery Loan: $18,000
- Total Liabilities: $28,000
Stockholders' Equity:
- Owner's Capital: $15,000
- Retained Earnings: $22,000
- Total Equity: $37,000
Verification: $65,000 (Assets) = $28,000 (Liabilities) + $37,000 (Equity). It balances perfectly. If it doesn't, something is wrong — and that's actually the beauty of double-entry bookkeeping. The math always serves as a built-in error check.
The Cash Flow Statement: Follow the Money
Here's a truth that surprises many people: a company can be profitable on its income statement and still run out of cash. How? Because the income statement uses accrual accounting — it records revenue when earned and expenses when incurred, regardless of when cash actually changes hands.
The cash flow statement fixes this blind spot. It tracks the actual movement of cash into and out of the business during a specific period. As the old business saying goes: "Revenue is vanity, profit is sanity, but cash is king."
The cash flow statement is divided into three sections, each covering a different type of activity.
Operating Activities: The Day-to-Day Cash
This section shows cash generated or used by the company's core business operations. It starts with net income from the income statement and then makes adjustments for non-cash items and changes in working capital.
Key adjustments include:
- Adding back depreciation: Depreciation is an expense on the income statement but no cash actually leaves the business — the money was spent when the asset was purchased. So we add it back.
- Accounts receivable changes: If receivables increased by $5,000, that means the company recorded $5,000 in revenue it hasn't collected yet. Cash flow is reduced by that amount.
- Inventory changes: An increase in inventory means cash was spent buying goods that haven't been sold yet.
- Accounts payable changes: If payables increased, the company received goods but hasn't paid for them yet — so cash is higher than expenses suggest.
For Sweet Rise Bakery, operating cash flow might look like this:
- Net Income: $46,125
- Add back Depreciation: +$4,000
- Increase in Accounts Receivable: -$3,000
- Increase in Inventory: -$1,500
- Increase in Accounts Payable: +$2,000
- Cash from Operating Activities: $47,625
Notice that operating cash flow ($47,625) is different from net income ($46,125). This gap exists because of non-cash charges and timing differences in when cash is collected and paid.
Investing Activities: Building for the Future
This section covers cash spent on or received from long-term assets. It tells you whether the company is investing in its future growth or selling off its assets.
Common investing activities include:
- Capital expenditures (CapEx): Purchasing new equipment, buildings, or technology — cash outflow
- Sale of assets: Selling old equipment or property — cash inflow
- Purchasing investments: Buying stocks, bonds, or other financial instruments
- Acquisitions: Buying another company or business unit
For our bakery:
- Purchase of new display refrigerator: -$8,000
- Sale of old oven: +$3,500
- Cash used in Investing Activities: -$4,500
A negative number in investing activities is usually a good sign — it means the company is spending money on assets that will generate future revenue. A company that consistently shows positive investing cash flow might be liquidating assets, which could be a red flag.
Financing Activities: Where the Capital Comes From
The financing section shows how a company raises and returns capital. It covers transactions between the company and its owners and creditors.
Common financing activities include:
- Issuing stock: Selling new shares to investors — cash inflow
- Paying dividends: Distributing profits to shareholders — cash outflow
- Taking out loans: Borrowing money from banks or issuing bonds — cash inflow
- Repaying debt: Paying back loan principal — cash outflow
- Share buybacks: Repurchasing company stock from the market — cash outflow
For the bakery:
- Loan repayment: -$6,000
- Owner's drawings (personal withdrawals): -$24,000
- Cash used in Financing Activities: -$30,000
The Complete Cash Flow Picture
Now let's combine all three sections for Sweet Rise Bakery:
- Cash from Operating Activities: +$47,625
- Cash used in Investing Activities: -$4,500
- Cash used in Financing Activities: -$30,000
- Net Change in Cash: +$13,125
If the bakery started the year with $12,000 in cash, its ending cash balance would be $25,125. But wait — the income statement showed net income of $46,125, while the actual net cash increase was only $13,125. Where did the difference go?
The answer: the owner took out $24,000 in drawings, $6,000 went to loan repayment, $8,000 went to a new refrigerator, while depreciation add-back and working capital changes made up the rest. This is precisely why the cash flow statement exists — profit and cash are not the same thing.
Bringing It All Together
The income statement, balance sheet, and cash flow statement are not three separate stories — they're three chapters of the same book. Here's how they connect:
- The net income from the income statement flows into retained earnings on the balance sheet — it's how profits accumulate over time.
- The cash flow statement starts with net income from the income statement and reconciles it to the actual cash position shown on the balance sheet.
- The ending cash balance on the cash flow statement must match the cash reported in the assets section of the balance sheet.
- Capital expenditures in the cash flow statement create new assets on the balance sheet and future depreciation expenses on the income statement.
No single financial statement tells the whole story. A company might show impressive revenue growth on its income statement while quietly drowning in debt on its balance sheet. Another might report modest profits while generating massive operating cash flow. You need all three to see the complete picture.
As Charlie Munger wisely observed: "It is remarkable how much long-term advantage people like us have gotten by trying to be consistently not stupid, instead of trying to be very intelligent." When it comes to financial statements, simply understanding these three documents and how they interact puts you ahead of the vast majority of people making financial decisions. You don't need to be a CPA — you just need to read the numbers, ask the right questions, and let the statements tell you what's really going on inside a business.
Recommended for you
Accounting: The Language of Business
Accounting is like a notebook for a business where all the money-related activities are recorded and tracked. Just like students track their exam scores to understand how they are doing, businesses use accounting to see if they are making a profit or loss. It acts like the financial backbone of a company. Accountants organize these records into different sections to make things easier to understand. To show their performance to shareholders, companies prepare documents called financial statements.
Banking
Banking: What It Is, How Banks Work, and Everything You Need to Know

Business
Red Ocean and Blue Ocean Strategy: Fight the Competition or Make It Irrelevant — The Complete Guide

Business
What is Equity? A Comprehensive Guide to Ownership, Value, and ROE

Books
The $100 Startup

Branding
Branding: How to Make Your Business Stand Out

Business Models
Sharing Economy Model: How Businesses Make Money Without Owning Anything
Logo
Types of Logos: A Complete Guide to Every Logo Style You See Every Day

Accounting
Corporate Taxation and International Tax Challenges Explained
Accounting
Tax Rebate: Definition, Types, and How to Claim One
