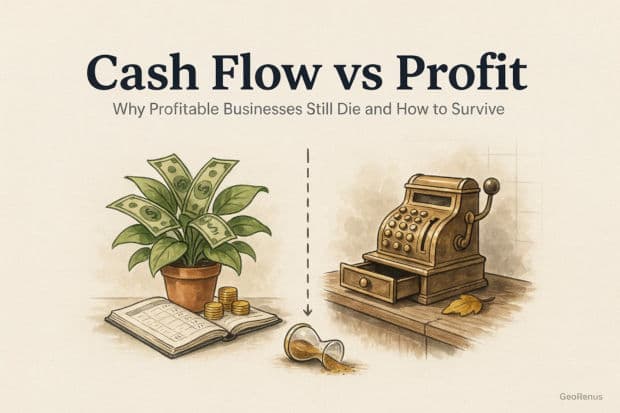
Cash Flow vs Profit -- Why Profitable Businesses Still Die and How to Survive
G
GeoRenus Editorial Team
477 views
Summary
Profit is the difference between revenue and expenses on paper -- it appears on your income statement. Cash flow is the actual money moving in and out of your business -- it appears in your bank account. A business can be profitable on paper yet die from a cash crisis. According to US Bank (2025), 82% of business failures are caused by cash flow problems, not lack of profit. Toys R Us had $11.5 billion in revenue and showed profit, yet filed for bankruptcy because $5 billion in debt payments drained all cash. This guide explains the critical difference between profit and cash flow, why profitable businesses fail, how to read a cash flow statement, real-world case studies (Toys R Us, WeWork, Evergrande), and 10 strategies to improve your cash flow.
Key Takeaways
- Profit is revenue minus expenses on paper (accrual basis); cash flow is actual money moving in and out of your business -- they are not the same thing.
- US Bank (2025) reports that 82% of business failures are caused by cash flow problems, not lack of profit or a bad product.
- Toys R Us had $11.5 billion in revenue and was profitable, but $5 billion in LBO debt payments drained all its cash, forcing bankruptcy in 2017.
- The seven top reasons profitable businesses run out of cash are: accounts receivable delays, overstocking, over-expansion, debt servicing, seasonality, CapEx timing, and customer concentration.
- Operating Cash Flow (OCF) is the most important number in the cash flow statement -- it measures cash generated by the core business, stripped of accounting adjustments.
- Free Cash Flow (FCF) = Operating Cash Flow minus Capital Expenditures. Apple's FCF was approximately $110 billion in 2025, funded by its core operations.
- The median small business holds only 27 days of cash buffer (JPMorgan Chase Institute, 2025) -- barely enough to survive a single slow month.
- Implementing a 13-week rolling cash flow forecast is the single highest-return, lowest-cost intervention available to any business owner.
- The three core cash flow improvement levers are: collect receivables faster, extend payables without damaging supplier relationships, and optimize inventory to release trapped cash.
- Revenue is vanity, profit is sanity, cash is reality -- the most important financial principle every business owner must internalize.
Introduction -- Profitable Yet Dead
In 2017, Toys R Us filed for bankruptcy with $11.5 billion in annual revenue and a business that showed profit on paper. The brand was iconic. Parents loved it. Kids begged to go there. And yet, a $5 billion debt burden from a leveraged buyout drained every dollar of cash the company generated, leaving nothing to pay suppliers, upgrade stores, or compete with Amazon. Toys R Us did not die because it stopped being profitable. It died because it ran out of cash.
Cash is oxygen for a business. You can go without food for weeks, but without oxygen, you last minutes. -- Warren Buffett
This is the brutal reality of business finance: profit and cash flow are not the same thing, and confusing them kills companies.
WeWork had $1.8 billion in revenue in 2019. It was burning $200 million every single month in cash. Investors poured billions in, celebrated the growth story, and watched the company nearly collapse before a last-minute rescue. The income statement looked busy. The bank account was bleeding out.
According to US Bank (2025), 82% of business failures are caused by poor cash flow management -- not lack of profit, not bad products, not weak marketing.
This guide is for every business owner, entrepreneur, finance student, and investor who has ever looked at a profit figure and felt safe. You are about to discover why that safety is an illusion -- and exactly what to do about it. By the end, you will understand the critical difference between profit and cash flow, why profitable companies die, how to read a cash flow statement, and 10 proven strategies to keep your business breathing.
What Is Profit?
Profit is what is left over after you subtract your expenses from your revenue. It lives on the income statement -- also called the profit and loss statement -- and it is calculated using accrual accounting. That last part is crucial. Under accrual accounting, you record revenue when you earn it, not when you actually receive the money. You record expenses when they are incurred, not when you pay them. This creates a gap between what the numbers say and what is actually in your bank account.
Three Types of Profit
Gross Profit is revenue minus the direct cost of goods sold. If you sell a shirt for $50 and it cost $20 to make, your gross profit is $30.
Operating Profit (EBIT) subtracts operating expenses like rent, salaries, and utilities from gross profit. It shows how much the core business earns before interest and taxes.
Net Profit is the final bottom line after deducting interest payments and taxes. This is what most people mean when they say a company is profitable.
The Fatal Limitation of Profit
Alfred Rappaport, the finance scholar who pioneered shareholder value theory, once said that accounting profits are a matter of opinion, while cash is a matter of fact. Think about what that means in practice. Imagine you run a garment factory. In March, you sell 10 lakh taka worth of fabric to a large retailer on 90-day credit terms. Your income statement immediately records 10 lakh in revenue and a healthy profit. But your cash account shows zero new money. Your fabric is gone, your workers still need to be paid this week, and your supplier invoice is due in 30 days. You are profitable on paper and struggling to survive in reality.
Accounting profits are a matter of opinion. Cash is a matter of fact. -- Alfred Rappaport
Profit tells you how well your business performed over a period. It does not tell you whether you can make payroll next Friday. That is why cash flow matters so much more in the short run -- and often in the long run too.
What Is Cash Flow?
Cash flow is the actual movement of money into and out of your business. It is not estimated, not accrued, not opinion. It is the cold, hard reality of what is in your bank account. A cash flow statement -- one of the three core financial statements -- tracks every dollar that enters and exits the business over a specific period. Unlike the income statement, it uses cash basis accounting: money counts only when it actually changes hands.
Operating Cash Flow (OCF)
Operating cash flow measures cash generated by the core business operations -- collecting from customers, paying suppliers, paying salaries, and covering day-to-day expenses. It is the most important indicator of business health. A company with consistently positive OCF can fund its own growth without relying on debt or equity. Apple reported operating cash flow of approximately $118 billion in fiscal year 2025, which is why it could buy back stock, pay dividends, and fund R&D without borrowing a single dollar.
Investing Cash Flow
Investing cash flow covers money spent buying or selling long-term assets -- things like machinery, real estate, equipment, or acquisitions of other businesses. It is almost always negative for growing companies, because they are spending cash to build capacity. A consistently negative investing cash flow is not necessarily bad. It means the company is investing in its future. But it must be funded by strong operating cash flow or external financing.
Financing Cash Flow
Financing cash flow tracks money coming in from or going out to investors and lenders. Issuing new shares, taking on loans, repaying debt, or paying dividends -- all of these appear here. WeWork showed massive positive financing cash flow for years because it kept raising billions from investors. The problem was that its operating cash flow was deeply negative, meaning it was burning through investor money faster than it could generate its own.
Free Cash Flow (FCF)
Free Cash Flow = Operating Cash Flow minus Capital Expenditures. It represents the cash a business generates after investing in its own maintenance and growth. This is the number that legendary investors like Warren Buffett use to value businesses. Apple's FCF in 2025 was approximately $110 billion -- meaning it generated $110 billion in pure, usable cash after all spending. That is why Apple has been able to return over $90 billion to shareholders in a single year.
| Cash Flow Type | What It Measures | Healthy Sign | Warning Sign |
| Operating CF | Core business cash generation | Consistently positive and growing | Negative or declining trend |
| Investing CF | Asset purchases and sales | Negative (investing in growth) | Selling core assets to survive |
| Financing CF | Debt and equity transactions | Manageable debt repayment | Heavy reliance on new borrowing |
| Free Cash Flow | Cash after capex | Positive and growing | Negative for 3+ consecutive years |
Note: Free Cash Flow is the preferred metric for business valuation by institutional investors. Source: McKinsey, 2025.
Understanding these four types is not just academic. They are your business survival toolkit. A company with strong OCF but weak FCF may be over-investing. A company with positive FCF but negative financing CF is aggressively paying down debt -- often a sign of financial maturity and discipline.
Profit vs Cash Flow -- The Critical Difference
Here is the question that trips up even experienced business owners: how can a company show profit on paper while simultaneously running out of money? The answer lies in the mechanics of accrual accounting and the timing gaps it creates between recognizing revenue and actually collecting cash. This is not a theoretical quirk -- it is the most dangerous financial trap in business.
Why Profit Can Exist Without Cash -- 5 Reasons
1. Credit Sales (Accounts Receivable): You deliver goods or services and record revenue immediately. But the customer pays in 60 or 90 days. Your profit is booked. Your cash is not there yet.
2. Inventory Build-Up: You manufacture 5,000 units but sell only 2,000. The 3,000 unsold units are recorded as an asset on your balance sheet, not an expense. Your costs are real and paid, but the offsetting revenue has not arrived yet.
3. Depreciation Adjustment: Depreciation is an accounting expense that reduces profit but involves zero cash leaving your business. A $1 million machine depreciated over 10 years costs you $100,000 per year on the income statement with no cash payment.
4. Prepaid Expenses: You pay 12 months of rent upfront in January. The income statement spreads this cost over 12 months. But in January, you paid all the cash at once.
5. Capital Expenditures: You buy a $500,000 piece of equipment. The income statement only shows the annual depreciation ($50,000/year). But you paid $500,000 in cash this year.
Why Cash Can Exist Without Profit -- 3 Reasons
1. Customer Advances / Deferred Revenue: A software company collects $12,000 upfront for an annual subscription in January. Cash is in the bank. But profit is recognized at $1,000/month over 12 months. Cash-rich, not yet profitable.
2. Borrowing: Taking out a $1 million bank loan puts cash in your account immediately. But it is a liability, not profit. Your cash balance soars; your profit is unchanged.
3. Selling Assets: Selling a property or piece of equipment generates a cash inflow. If you sell it at book value, there is no profit impact. Cash arrives, profit does not change.
The Garment Factory Walkthrough -- A Vivid Example
Let us make this real. Imagine you own a mid-sized garment factory in Dhaka. In Q1 2025, you take a massive order from a European retailer: $500,000 worth of garments to be delivered in March with payment due in June on 90-day terms. You buy $200,000 in raw materials (paid immediately), pay $100,000 in labor and overhead, and deliver the goods on time. Your income statement for Q1 looks magnificent: $500,000 in revenue, $300,000 in costs, $200,000 in profit. You show the statement to your bank manager and everyone is impressed.
But here is what your bank account actually shows. You spent $300,000 in cash (materials and labor). You received $0 from the European retailer. Your cash position dropped by $300,000. Meanwhile, your fabric supplier's invoice for the next order is due. Your workers need to be paid this month. You are sitting on $200,000 in profit and you cannot make payroll. This is not a hypothetical. This happens every day to profitable businesses around the world.
| Dimension | Profit | Cash Flow |
| Definition | Revenue minus expenses (accrual basis) | Actual money in minus money out |
| Timing | Recorded when earned/incurred | Recorded when received/paid |
| Statement | Income Statement (P&L) | Cash Flow Statement |
| Can be manipulated? | Yes (accounting choices) | Harder to manipulate |
| Taxes based on this? | Yes (net profit) | No |
| Valuation basis? | P/E ratio uses net profit | DCF models use FCF |
| Includes depreciation? | Yes (reduces profit) | Added back (non-cash) |
| Includes CapEx? | Only depreciation portion | Full cash outflow recorded |
| Includes credit sales? | Yes (revenue recorded) | No (until cash received) |
| Includes loan proceeds? | No | Yes (financing inflow) |
| Short-run survival? | Low relevance | Critical -- determines survival |
| Long-run viability? | Important signal | Equal importance |
Note: Both profit and cash flow are necessary. Profit ensures long-run viability; cash flow ensures short-run survival. Source: Investopedia, 2025.
The most dangerous phrase in business finance is 'we are profitable.' Profitability tells you that your business model works. Cash flow tells you whether you will still be in business next quarter. You need both -- but when they conflict, cash wins every time.
Why Profitable Businesses Die -- 7 Reasons
Profitability creates a dangerous sense of security. Business owners look at the income statement, see green numbers, and assume they are safe. Then they miss payroll. Then they cannot pay a supplier. Then they get a call from their bank. The seven killers below are the most common, most preventable reasons why profitable businesses run out of cash and collapse.
Reason 1: Accounts Receivable Delays
When you sell on credit, you book the profit immediately but wait 30, 60, or 90 days for the cash. During that waiting period, your expenses keep coming. According to Atradius (2025), 48% of all B2B invoices in the US are paid late -- averaging 13 days beyond the agreed terms. For a business with $2 million in outstanding receivables, a 45-day average collection period means $246,000 is perpetually trapped in unpaid invoices, unavailable to fund operations.
Reason 2: Overstocking and Inventory Build-Up
Inventory is cash that has been converted into physical goods. When you overbuy or overstock, you have tied up cash that cannot pay bills until the inventory sells. Retailers are particularly vulnerable. A clothing retailer that orders $500,000 of winter stock in October may not convert that into cash until December or January -- creating a two-month cash crunch even if their annual profit margin is healthy. Peloton learned this painfully in 2021-2022, accumulating over $1.4 billion in unsold inventory that forced them to slash prices, destroy margins, and raise emergency financing.
Reason 3: Over-Expansion and Scaling Too Fast
Growth is cash-hungry. Opening a new location requires upfront rent deposits, fit-out costs, hiring, and inventory -- all paid before a single dollar of revenue arrives. Many businesses expand on the strength of their current profitability without stress-testing whether their cash reserves can fund the ramp-up period. WeWork expanded to 111 cities across 29 countries by 2019. Each new location required massive upfront cash. The revenue came later -- if at all. The result was $200 million in monthly cash burn against $1.8 billion in annual revenue.
Reason 4: Debt Servicing -- The Silent Cash Killer
Debt repayments do not appear as operating expenses on the income statement. You pay interest (which is an expense) and principal (which is not -- it is a balance sheet repayment). A company can show strong operating profit while hemorrhaging cash through debt repayments. Toys R Us had $5 billion in debt from its 2005 leveraged buyout by KKR, Bain Capital, and Vornado. Annual interest and principal payments consumed virtually all of its operating cash flow, leaving nothing for digital transformation, store upgrades, or competitive response to Amazon.
Reason 5: Seasonality and Timing Gaps
Many businesses earn most of their revenue in a few concentrated months but carry fixed costs year-round. A resort hotel might generate 70% of its annual cash in summer but still owes staff salaries, insurance, and maintenance in January. Without deliberate cash reserves built during the peak season, businesses die in the off-season even though their annual profit looks fine. The JPMorgan Chase Institute found in its 2025 analysis that most small businesses hold only 27 days of cash buffer -- barely enough to survive a single slow month.
Reason 6: Capital Expenditure Timing
When you buy a $2 million piece of manufacturing equipment, you pay the cash immediately. But the income statement only recognizes the annual depreciation -- perhaps $200,000 per year over 10 years. In the year of purchase, your cash drops by $2 million while your profit only decreases by $200,000. If you do not plan for this gap, a single major capital purchase can tip a healthy, profitable business into a cash crisis. This is why wise CFOs separate operational cash flow planning from capital expenditure planning.
Reason 7: Customer Concentration Risk
When one or two customers represent 60% or more of your revenue, you are one delayed payment away from crisis. If your largest customer -- who generates 40% of your profit -- delays payment by 60 days due to their own financial troubles, your cash flow collapses even though your income statement still shows profit. CB Insights (2025) found that customer concentration was a contributing factor in 23% of small business failures, often invisible in profitability metrics until the cash crisis hit.
| Killer | Cash Impact | Real-World Example | Warning Sign |
| Accounts Receivable Delays | Cash trapped in unpaid invoices | 48% B2B invoices paid late (Atradius 2025) | DSO rising above 45 days |
| Overstocking | Cash locked in unsold goods | Peloton $1.4B inventory crisis 2022 | Inventory turnover slowing |
| Over-Expansion | Upfront costs exceed revenue ramp | WeWork $200M/month burn rate | New locations cash-flow negative 6+ months |
| Debt Servicing | Principal payments drain OCF | Toys R Us $5B debt load | DSCR below 1.2x |
| Seasonality | Off-season fixed costs exceed reserves | Resorts, retailers, agriculture | Only 27 days cash buffer (JPMorgan 2025) |
| CapEx Timing | Large cash outflows, small P&L impact | Manufacturing equipment purchases | Free cash flow turns negative post-purchase |
| Customer Concentration | One delayed payment = crisis | 23% SME failures (CB Insights 2025) | Top 2 customers > 50% of revenue |
Note: DSCR = Debt Service Coverage Ratio. A ratio below 1.2x means operating income barely covers debt payments -- a red flag for lenders. Source: Forbes, 2025.
Every one of these killers is preventable with awareness and planning. The tragedy is not that businesses fail from these causes -- it is that they fail from causes that were visible months in advance, had anyone been watching the cash flow statement rather than celebrating the profit number.
How to Read a Cash Flow Statement
The cash flow statement is the most honest document in your financial reporting package. Unlike the income statement -- which is shaped by accounting choices, depreciation methods, and revenue recognition policies -- the cash flow statement is brutally direct. Money came in or it did not. Money went out or it did not. Here is how to read it, step by step, using a worked example.
The Structure of a Cash Flow Statement
A standard cash flow statement has three sections. Section one covers operating activities -- the cash generated by the core business. Section two covers investing activities -- cash spent on or received from assets. Section three covers financing activities -- cash from or to investors and lenders. The net total of these three sections equals the change in your cash balance for the period.
Worked Example: Horizon Manufacturing Ltd., Q1 2025
| Line Item | Amount (USD) | What It Means |
| Net Income (from P&L) | $500,000 | Profit reported on income statement |
| Add: Depreciation | +$80,000 | Non-cash expense added back |
| Add: Amortization | +$20,000 | Non-cash expense added back |
| Less: Increase in Accounts Receivable | -$350,000 | More sales on credit -- cash not yet received |
| Less: Increase in Inventory | -$180,000 | More stock purchased -- cash tied up |
| Add: Increase in Accounts Payable | +$60,000 | Paying suppliers slower -- cash conserved |
| = Operating Cash Flow (OCF) | $130,000 | Actual cash from core operations |
| Less: Equipment Purchase (CapEx) | -$400,000 | Cash paid for new machinery |
| Add: Sale of Old Equipment | +$50,000 | Cash received from asset sale |
| = Investing Cash Flow | -$350,000 | Net cash used in investing |
| Add: New Bank Loan | +$200,000 | Cash from borrowing |
| Less: Loan Repayment | -$80,000 | Cash used to repay debt |
| = Financing Cash Flow | +$120,000 | Net cash from financing |
| = Net Change in Cash | -$100,000 | Cash balance DECREASED by $100,000 |
Note: Despite showing $500,000 in net income, Horizon's cash balance decreased by $100,000 in Q1 2025. This is the profit-cash gap in action.
What This Statement Tells You
Horizon looks like a profitable company on the income statement. But the cash flow statement reveals the truth: massive accounts receivable growth ($350,000 trapped in credit sales), heavy inventory build-up ($180,000 tied in stock), and a large equipment purchase ($400,000) that the income statement barely reflects. The net result is that despite half a million dollars in profit, the company has less cash at the end of the quarter than it had at the start.
Key ratios to watch: Operating Cash Flow Ratio (OCF / Current Liabilities) should be above 1.0. Cash Flow Margin (OCF / Revenue) should be above 10%. CapEx Coverage (OCF / CapEx) should be above 1.5 for sustainability.
Once you learn to read a cash flow statement, you will never look at a profit figure the same way again. The profit might be real. But the cash flow statement tells you whether the business is actually generating usable, bankable, payroll-covering money -- or just accounting entries.
Case Studies -- Profitable Companies That Died from Cash Flow Failure
The best way to understand a financial concept is to see it destroy a real business. The four case studies below represent different industries, different root causes, and different scales -- but they share one common thread: their cash flow problems were visible months or years before the collapse. The leaders who ignored these signals paid with their companies.
Toys R Us -- The LBO That Drained Every Dollar
In 2005, private equity firms KKR, Bain Capital, and Vornado Realty Trust acquired Toys R Us in a leveraged buyout valued at $6.6 billion. The deal was structured by loading $5 billion of that acquisition debt onto Toys R Us itself. From that moment on, the company was paying approximately $400-500 million per year in debt interest and principal -- money that should have been used to build an e-commerce platform, renovate stores, and compete with Amazon and Walmart. When Amazon began aggressively entering the toy market in the early 2010s, Toys R Us had no cash reserves to respond. It filed for Chapter 11 bankruptcy in September 2017 with $11.5 billion in annual revenue and closed all 735 US stores in 2018, eliminating 33,000 jobs. The business was profitable. The cash flow was catastrophically broken.
WeWork -- Growth Theater Masking a Cash Furnace
WeWork grew from a single coworking space in New York in 2010 to a global empire of 528 locations in 111 cities by 2019. CEO Adam Neumann was celebrated as a visionary. The company raised $12.8 billion from SoftBank alone. But behind the TED talks and celebrity culture was a brutal financial reality: WeWork signed 10-15 year building leases (long-term cash obligations) and rented spaces to customers on month-to-month terms (short-term, volatile cash inflows). In 2019, WeWork burned $219 million per month in cash. Its S-1 filing ahead of its planned IPO revealed these figures to public investors for the first time. The IPO was pulled. Neumann was ousted. SoftBank provided a $9.5 billion bailout. WeWork eventually filed for bankruptcy in November 2023. Revenue of $1.8 billion masked a cash furnace that could never be extinguished.
Peloton -- When the Pandemic Boom Became an Inventory Nightmare
Peloton was one of the great pandemic success stories. Locked-down consumers bought stationary bikes and treadmills at a furious pace. Revenue grew from $915 million in FY2020 to $4.0 billion in FY2021. Peloton's management, convinced the boom would continue, ordered massive amounts of new inventory and committed to expensive supply chain expansions. Then gyms reopened, demand normalized, and Peloton was left holding over $1.4 billion in unsold inventory by early 2022. To clear it, they slashed prices -- destroying profit margins. The cash cost of building that inventory had already been paid, but the cash from selling it was not materializing at expected prices. Shares fell 95% from peak. The CEO resigned. The company raised $750 million in emergency financing in February 2022 just to stay alive.
Evergrande -- $300 Billion and No Cash to Show for It
China Evergrande Group was once the world's most valuable real estate developer, with assets exceeding $350 billion. Its business model was straightforward: collect cash from homebuyers upfront (sometimes years before construction began), use that cash to fund new land purchases, and repeat. This worked spectacularly as long as property prices rose and buyers kept coming. When China's government introduced the 'three red lines' policy in 2020 to restrict developer leverage, and when property demand softened in 2021, Evergrande's model collapsed. It had $300 billion in liabilities, thousands of unfinished apartment projects, and no cash to complete them. It defaulted on $300 billion in debt in December 2021. The profitability of its model depended entirely on perpetual cash inflows that could not survive a regulatory change.
| Company | Revenue Before Failure | Root Cash Flow Cause | Outcome |
| Toys R Us | $11.5B (2016) | $5B LBO debt, $400-500M/yr in repayments | Bankruptcy 2017, 33,000 jobs lost |
| WeWork | $1.8B (2019) | $219M/month cash burn, lease mismatch | IPO pulled, $9.5B bailout, bankruptcy 2023 |
| Peloton | $4.0B (FY2021) | $1.4B inventory trap, demand collapse | 95% share price drop, CEO resignation, $750M emergency raise |
| Evergrande | $113B (2020) | $300B liabilities, prepayment model collapse | Historic $300B default 2021 |
Note: All four companies had positive revenue and reported profits in the years before their cash crises. Revenue and profit alone are not reliable survival indicators. Source: WSJ, Forbes, HBR, 2025.
These are not isolated accidents. They are textbook examples of what happens when leadership focuses on profit, growth, and valuation while ignoring cash flow mechanics. The warning signs were visible in their cash flow statements long before the crises became public. Investors who read those statements -- and acted -- protected their capital. Those who only looked at revenue growth and profit did not.
10 Strategies to Improve Your Cash Flow
Every cash flow problem has a solution. The solutions are not glamorous -- they are operational, disciplined, and sometimes uncomfortable. But they work. The businesses that survive recessions, supply chain shocks, and competitive disruptions are not necessarily the most profitable ones. They are the ones with the strongest cash positions. Here are 10 strategies that work in 2025 and beyond.
Strategy 1: Speed Up Collections (Reduce DSO)
Days Sales Outstanding (DSO) is the average number of days it takes to collect payment after a sale. The lower this number, the faster cash flows in. Practical tactics: offer 1-2% early payment discounts for customers who pay within 10 days; require deposits of 25-50% upfront for large orders; send invoices the same day work is delivered rather than at month-end; use automated invoice reminders at 7, 14, and 30 days past due. McKinsey research shows that companies with DSO below 30 days have 40% fewer cash crises than those with DSO above 60 days.
Strategy 2: Extend Payables (Without Damaging Relationships)
Negotiate longer payment terms with your suppliers -- 45 or 60 days instead of 30 -- without sacrificing the relationship. Pay large suppliers on time but smaller ones slightly later. Use supplier financing programs offered by major banks, where the bank pays your supplier immediately and you repay the bank on extended terms. The goal is to collect cash from customers before you have to pay suppliers, creating a natural cash generation cycle.
Strategy 3: Optimize Inventory -- Keep Only What Sells
Every dollar sitting in inventory is a dollar not available for operations. Implement just-in-time inventory ordering for fast-moving items. Set maximum stock levels and enforce them. Use ABC analysis -- categorize inventory into high-value fast-movers (A), moderate items (B), and slow-movers (C) -- and focus your capital on A items only. Liquidate C items at a discount rather than carrying them. QuickBooks (2025) found that businesses that actively manage inventory turn their cash over 2.3 times faster than those that do not.
Strategy 4: Build Subscription or Retainer Revenue
Subscription and retainer contracts collect cash upfront or on a regular cadence, fundamentally changing your cash flow profile. A consulting firm that shifts from project billing to a monthly retainer model collects cash before delivering services. A software company with annual subscriptions receives 12 months of cash in month one. Even a service business can offer monthly maintenance contracts that smooth cash inflows. Adobe's shift from perpetual licensing to Creative Cloud subscriptions in 2012-2013 transformed its cash flow from lumpy and unpredictable to smooth and highly predictable.
Strategy 5: Cut Waste -- The Cash You Do Not Spend Is Already Yours
Conduct a quarterly audit of every recurring expense. Cancel software subscriptions that are not actively used. Renegotiate leases, insurance policies, and service contracts. Reduce energy consumption through operational changes. These savings go directly to cash without requiring any new sales. For a business spending $1 million per month, a 5% waste reduction generates $50,000 per month in additional cash -- the equivalent of a $600,000 annual revenue increase at a 10% margin.
Strategy 6: Build a Cash Reserve of 3-6 Months of Operating Expenses
The JPMorgan Chase Institute found in 2025 that the median small business holds just 27 days of cash buffer. Most financial advisors recommend 90-180 days. Build this reserve deliberately: set aside a fixed percentage of every month's cash inflows into a dedicated reserve account. Treat it as non-negotiable. This reserve is your oxygen supply -- it is what keeps you breathing through a slow quarter, a bad debt write-off, or a supply chain disruption.
Strategy 7: Use Invoice Factoring and Supply Chain Financing
If your customers pay slowly and you cannot afford to wait, invoice factoring lets you sell your receivables to a factoring company at a small discount (typically 1-3%) in exchange for immediate cash. For a business with $500,000 in outstanding invoices and a 60-day collection period, factoring at 2% costs $10,000 but delivers $490,000 in cash immediately. Supply chain financing works in reverse -- your large-company customers enable their suppliers (you) to access low-cost financing backed by the customer's credit rating.
Strategy 8: Plan for Seasonality -- Build During Peaks, Reserve for Valleys
If your business is seasonal, your cash flow planning must be seasonal. During your peak season, build cash reserves aggressively -- these will fund your fixed costs during the off-season. Create a 12-month rolling cash flow forecast that shows explicitly when cash will be abundant and when it will be scarce. Use the forecast to time major expenditures (equipment purchases, hiring) during peak cash periods, not valleys.
Strategy 9: Lease vs. Buy -- Match Cash Outflows to Asset Useful Life
A $500,000 equipment purchase drains cash immediately but only reduces profit by the annual depreciation. Leasing the same equipment might cost $8,000 per month -- a smaller, predictable cash outflow that aligns with the revenue the equipment generates. This is not always the right choice (leasing costs more over the long run), but for businesses with tight cash, leasing can be the difference between survival and crisis. Evaluate every major asset purchase on a lease-vs-buy cash flow basis, not just a total-cost basis.
Strategy 10: Implement a 13-Week Rolling Cash Flow Forecast
The single most powerful cash flow management tool is a 13-week rolling forecast. Every week, you project your expected cash inflows (from customers, scheduled collections, other sources) and outflows (payroll, rent, suppliers, debt payments, taxes) for the next 13 weeks. This gives you a 90-day forward view of your cash position with enough lead time to take action before a crisis hits. Businesses that maintain a 13-week forecast are 3 times less likely to experience a payment default, according to HBR (2025).
| Strategy | Primary Effect | Implementation Difficulty | Cash Impact Timeline |
| Speed up collections | Reduce DSO | Medium | 30-60 days |
| Extend payables | Delay cash outflows | Low-Medium | Immediate |
| Optimize inventory | Release trapped cash | Medium | 60-90 days |
| Subscription model | Predictable inflows | High (requires product shift) | 3-12 months |
| Cut waste | Reduce outflows directly | Low | Immediate |
| Build cash reserve | Create safety buffer | Medium (requires discipline) | 6-12 months |
| Invoice factoring | Accelerate receivables | Low | 1-5 days |
| Seasonal planning | Smooth cash cycles | Medium | 1-2 seasons |
| Lease vs Buy | Reduce large cash spikes | Low | At purchase decision |
| 13-week forecast | Identify problems early | Medium | Ongoing |
Note: Combining strategies 1, 6, and 10 -- faster collections, a cash reserve, and a rolling forecast -- provides the strongest baseline cash flow protection for any business size. Source: HBR, McKinsey, 2025.
None of these strategies requires a finance degree. They require attention, discipline, and the willingness to prioritize cash over the vanity metrics of revenue and profit. Start with the 13-week forecast. It costs nothing and reveals everything.
Cash Flow Management -- Do's and Don'ts
The difference between businesses that survive financial stress and those that do not is rarely about intelligence or market opportunity. It is almost always about habits and disciplines. The following do's and don'ts represent the distilled wisdom of cash flow management, backed by the case studies and data we have already covered.
Do's -- Habits That Keep Your Business Alive
Do maintain a 13-week rolling cash flow forecast. Review it every Monday morning. This single habit prevents more business failures than any other practice. It converts financial surprises into anticipated challenges.
Do separate your cash flow from your profit mindset. Train yourself and your team to ask 'what is our cash position?' before 'what is our profit?' Cash pays bills. Profit does not.
Do build a cash reserve of at least 3 months of operating expenses. Fund it like an investment account -- automatic, non-negotiable monthly contributions from operating cash.
Do negotiate payment terms aggressively on both sides. Shorter terms for receivables (30 days or less), longer terms for payables (45-60 days). This asymmetry generates cash from the timing gap.
Do send invoices immediately upon delivery. Every day you delay invoicing is a day you delay payment. Automate invoicing within 24 hours of service delivery or product shipment.
Do stress-test your cash flow before major decisions. Before hiring, expanding, or making a large purchase, model the cash impact over the next 90 days. If it creates a cash gap, plan the financing before you commit.
Do monitor your DSO, DPO, and inventory turnover weekly. DSO (Days Sales Outstanding), DPO (Days Payables Outstanding), and inventory turns are the three vital signs of working capital health. Know your numbers.
Don'ts -- Habits That Kill Cash Flow
Do not confuse strong revenue with strong cash flow. Revenue is what you billed. Cash is what you collected. A business can double its revenue and simultaneously run out of cash if collection is slow.
Do not spend cash reserves on growth without stress-testing. It is tempting to deploy a cash cushion on expansion when business is booming. But reserves exist for bad times, not good times. Raise new capital for growth; protect reserves for survival.
Do not allow receivables to age past 60 days without escalation. An invoice that is 90 days overdue has a 20-30% probability of never being paid (CB Insights, 2025). Chase aggressively at 31 days. Escalate at 45 days. Consider legal action at 90 days.
Do not buy inventory speculatively without firm orders. Purchasing inventory in anticipation of orders that may not materialize is one of the fastest ways to convert cash into a warehouse problem. Require purchase orders before you order stock.
Do not make major capital expenditures in low-cash periods. Time your asset purchases for when cash is abundant -- typically after your peak revenue season. Never buy equipment because it is on sale if your cash position is tight.
Do not operate without a minimum cash balance policy. Set a hard floor -- say, two months of operating expenses -- below which you will not allow your cash balance to drop without a formal board-level discussion and response plan.
Do not rely on a single large customer for more than 30% of revenue. Customer concentration is a cash flow time bomb. One slow payment from a dominant customer can trigger a crisis. Diversify actively, even if it means slower growth.
Advantages and Limitations of Cash Flow Management
Cash flow management is one of the most powerful financial disciplines available to a business owner. But like any tool, it has both strengths and limitations. Understanding both helps you deploy it effectively rather than treating it as a silver bullet -- or dismissing it as too complex to bother with.
| Advantages | Limitations |
| Provides real-time visibility into business survival capacity | Historical cash flow statements do not predict future cash needs without active forecasting |
| Enables early warning detection of financial stress months before crisis | Cash flow can appear strong due to one-time events (asset sales, loans) masking operational weakness |
| Grounds strategic decisions in financial reality rather than accounting optimism | Requires consistent discipline and weekly time investment -- many small business owners deprioritize this |
| Reduces reliance on expensive emergency financing and credit lines | Invoice factoring and other cash acceleration tools have costs that reduce margin |
| Builds trust with lenders and investors who value cash discipline | Strong cash flow management cannot compensate for a fundamentally broken business model |
| Allows businesses to take advantage of opportunities (discounts, acquisitions) that require fast cash | Over-optimization for cash can cause under-investment in growth opportunities |
| Improves negotiating position with suppliers and customers (strong cash = leverage) | Cash flow forecasting is only as accurate as the assumptions underlying it |
| Dramatically reduces the probability of insolvency during economic downturns | Does not address structural problems like pricing power, competition, or market size |
Note: The most effective financial leaders use cash flow management as a complement to -- not a replacement for -- strategic profit planning. Both are required. Source: McKinsey, 2025.
The limitation that matters most in practice is the second one: cash flow can look strong temporarily because of borrowing or asset sales while the underlying business bleeds. Always examine operating cash flow specifically -- the cash generated by the core business -- rather than total cash movement. A company whose operating cash flow is consistently positive and growing is fundamentally healthy. A company whose operating cash flow is negative but whose total cash flow is positive because it keeps borrowing is a time bomb.
Cash Flow Statistics 2025-2026
The data on cash flow and business failure is stark, consistent, and largely ignored until it is too late. The statistics below come from major research institutions, financial services firms, and industry surveys conducted in 2025 and 2026. They paint a clear picture: cash flow problems are not rare edge cases -- they are the dominant cause of business failure globally.
| Statistic | Figure | Source | What It Means |
| Business failures caused by cash flow problems | 82% | US Bank, 2025 | The vast majority of failures are cash-driven, not market-driven |
| Small businesses that run out of cash in first 5 years | 29% | CB Insights, 2025 | Nearly 1 in 3 businesses fail specifically from cash exhaustion |
| SMEs reporting cash flow as their primary challenge | 61% | QuickBooks SME Survey, 2025 | A majority of small businesses struggle with cash, not profit |
| Median days of cash buffer for small businesses | 27 days | JPMorgan Chase Institute, 2025 | Most businesses are 4 weeks from insolvency at any given time |
| B2B invoices paid late in the US | 48% | Atradius Payment Practices Barometer, 2025 | Nearly half of all business invoices are paid beyond agreed terms |
| Average days late on B2B invoices | 13 days | Atradius, 2025 | Extends average DSO by nearly 2 weeks beyond contracted terms |
| Companies with strong FCF outperforming peers | 2x | McKinsey Global Institute, 2025 | Free cash flow discipline creates sustained competitive advantage |
| Business owners who lose sleep over cash flow | 69% | QuickBooks, 2025 | Cash anxiety is pervasive among small business owners |
| SMEs with no formal cash flow forecast | 58% | SCORE / SBA, 2026 | Majority of small businesses navigate without a cash map |
| Probability of survival past year 10 with strong CF management | 71% | Investopedia / SBA data, 2025 | Strong cash flow management more than doubles 10-year survival odds |
Note: These statistics are drawn from studies conducted across US, UK, EU, and global emerging markets. Cash flow challenges are universal across geographies and industry sectors. Sources: US Bank, CB Insights, QuickBooks, JPMorgan Chase Institute, Atradius, McKinsey, SCORE, 2025-2026.
What the Numbers Tell Us
The 82% figure is the most important: it means that if you find yourself in financial trouble as a business, there is a 4 in 5 chance the root cause is cash flow, not profit. This fundamentally reshapes how you should prioritize your financial management efforts.
The 27-day buffer statistic is terrifying: it means the typical small business is perpetually one bad month away from insolvency. A single large customer defaulting, a supply chain disruption, or an unexpected tax bill could be fatal.
The 58% no-forecast finding is the most actionable: if your business does not have a rolling cash flow forecast, you are operating without a map in hazardous terrain. This is the highest-return, lowest-cost intervention available to any business owner.
These are not abstract statistics. Behind each percentage point is a business that closed, a family that lost its livelihood, employees who lost their jobs, and a community that lost a local enterprise. Cash flow management is not a finance topic. It is a human topic.
Conclusion -- Profit is How Well You Are Doing. Cash is How Long You Survive.
There is a saying in finance that has survived every market cycle, every technological disruption, and every economic crisis: revenue is vanity, profit is sanity, cash is reality. You can build a vanity business on impressive revenue numbers. You can build a sane business on solid profit margins. But only a business built on cash flow reality can survive long enough to matter.
Toys R Us was a beloved, profitable brand. It died because $5 billion in debt payments consumed every dollar it generated. WeWork was a revolution in how people work. It nearly died because it burned $219 million per month in cash that it could not replace with sustainable operating income. Peloton was the fitness phenomenon of the pandemic era. It nearly died because $1.4 billion in inventory sat unsold while cash evaporated. These were not failures of vision. They were failures of cash flow management.
Revenue is vanity, profit is sanity, cash is reality. -- Finance maxim
The core lessons of this guide are simple enough to write on a sticky note: profit tells you how well you are doing; cash tells you how long you will survive. Read your cash flow statement every week, not just your income statement. Build a 90-180 day cash reserve before you think you need it. Collect faster than you pay. And implement a 13-week rolling forecast before the end of this month.
The businesses that will thrive in 2025, 2026, and beyond are not necessarily the most innovative or the most profitable. They are the ones with disciplined cash flow management, early warning systems, and the humility to know that a strong income statement does not mean a healthy business. Cash flow is not a CFO's problem. It is every business owner's, every entrepreneur's, and every manager's fundamental responsibility.
Start today. Open a spreadsheet. List your expected cash inflows and outflows for the next 13 weeks. You may be surprised -- or alarmed -- by what you see. Either way, you will be better informed than 58% of your competitors. And that knowledge, acted upon early, is the difference between a business that survives and one that becomes a case study in what not to do.
Recommended for you

The Bretton Woods Agreement: A Turning Point in Global Economic History
In 1944, as the world was still engulfed in the devastation of World War II, the global economy had collapsed and people’s living standards had plummeted. In an effort to stabilize the international economy and address pressing global financial issues, the Allied nations convened a historic summit. Nearly 730 delegates from 44 countries gathered at the Mount Washington Hotel in Bretton Woods, New Hampshire, for the United Nations Monetary and Financial Conference. The outcome of this summit was the landmark Bretton Woods Agreement, which gave birth to the Bretton Woods System.
Money
How Money Works?
Business
What is Equity? A Comprehensive Guide to Ownership, Value, and ROE

Business
HORECA (Hotel Restaurant Catering Café): A Growing Marketing Channel in the Foodservice Industry

Branding
Branding: How to Make Your Business Stand Out

Business Models
Sharing Economy Model: How Businesses Make Money Without Owning Anything
Organization
What Is the International Monetary Fund (IMF)?
Startup
What Is a Startup? The Ultimate Guide You Need to Read

Accounting
Corporate Taxation and International Tax Challenges Explained
Accounting
Business Accounting: What It Is and How It Works