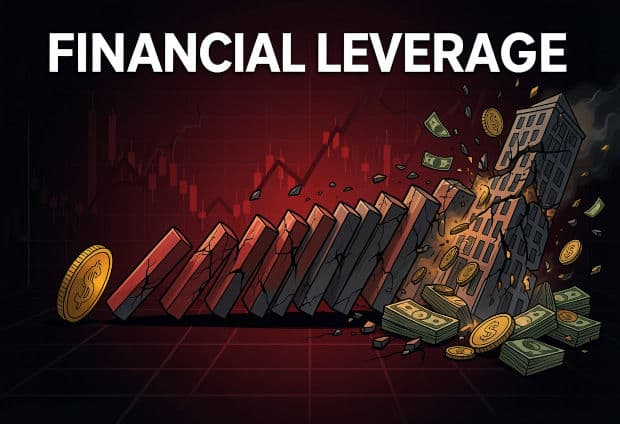
Financial Leverage: Profit Multiplier or Destruction Trap? -- The Great Debate with Evidence (Part 1)
G
GeoRenus Editorial Team
704 views
Summary
Financial Leverage means using borrowed money to amplify your investment returns. But is it a profit multiplier or a destruction trap? In Part 1 of this two-part debate, we examine both sides with hard evidence. Side 1 argues leverage is a multiplier: George Soros made $1 billion in a single day using leveraged currency bets, US homebuyers with 5:1 leverage earned 400%+ returns, and Apple strategically carries $100B+ in debt despite having $160B+ in cash. Side 2 argues leverage is a trap: Bill Hwang's Archegos lost $20 billion in 48 hours, LTCM's Nobel laureates lost $4.6 billion with 25:1 leverage, and the entire 2008 financial crisis was caused by banks leveraged 30:1. This article presents mathematical proofs for both sides, neutral data analysis, and fair criticism of each argument's weaknesses.
Key Takeaways
- Financial Leverage means using borrowed money to amplify investment returns -- it multiplies both profits AND losses equally
- Side 1 argues leverage is a profit multiplier: 3:1 leverage turns 15% return into 29%, Soros made $1B in one day, real estate investors achieved 400%+ returns
- Side 2 argues leverage is a destruction trap: Archegos lost $20B in 48 hours, LTCM Nobel laureates lost $4.6B, 2008 crisis (30:1 leverage) destroyed the global economy
- IMF 2025 data: highly leveraged firms are 3x more likely to default during recessions, 70%+ hedge fund blowups involve excessive leverage
- Both sides have weaknesses: pro-leverage suffers from survivorship bias, anti-leverage uses extreme examples that don't represent moderate leverage
- Part 2 covers: legendary investors' opinions, practical leverage calculator, 2025-2026 global landscape, and the Final Verdict
Introduction -- Borrowing to Invest: Genius or Madness?
March 2020. The world is shutting down. Hospitals are overwhelmed. Stock markets are in freefall. The S&P 500 has dropped 34% in just 33 days -- the fastest crash in history. Most investors are frozen in panic, watching their portfolios bleed out. But one man sees something different. He sees opportunity dressed in fear.
Chamath Palihapitiya, the billionaire venture capitalist and former Facebook executive, does not run. He charges in. He uses leveraged positions to load up on beaten-down tech stocks at the exact bottom of the crash. His $100 million deployment grows to over $1 billion in just 18 months. That is a 10x return -- the kind of number that turns skeptics into believers overnight. Leverage did not just help him. Leverage was the engine.
Now fast-forward exactly 12 months. March 2021. A different story begins unfolding -- this one in silence, behind closed doors, hidden from regulators and the public. Bill Hwang, a former protege of hedge fund legend Julian Robertson at Tiger Management, has built a family office called Archegos Capital Management. On paper, he manages roughly $20 billion. But the real exposure is far larger, because Hwang is using something called total return swaps -- a financial instrument that lets him hold massive positions in stocks like ViacomCBS, Discovery, and GSX Techedu WITHOUT those positions ever appearing on standard regulatory filings. His actual leverage: somewhere between 5:1 and 8:1.
Then ViacomCBS announces a stock offering. The price drops. Margin calls begin. And what happens next is one of the most spectacular financial collapses in Wall Street history. Within 48 hours, Goldman Sachs, Morgan Stanley, Credit Suisse, and Nomura are all racing to dump Hwang's positions before each other. Credit Suisse loses $5.5 billion. Nomura loses $3 billion. Bill Hwang loses everything -- every single dollar. And in 2024, he is convicted of fraud and racketeering. The man who was worth $20 billion is now facing prison.
What is staggering about the Archegos story is not just the size of the loss -- it is the speed. This was not a slow deterioration over months. This was a complete financial annihilation in two business days. Hwang went from managing one of the most profitable family offices in the world to owing money, facing criminal charges, and watching his counterparties scramble to contain the damage his positions had caused. The leverage that amplified his gains on the way up amplified his losses on the way down -- and amplified them so fast that there was no time to react, no time to reposition, no time to call anyone who could help.
Two men. Two stories. One tool: leverage. Chamath used it and became a billionaire. Hwang used it and lost everything, dragged banks down with him, and ended up in handcuffs. Same instrument. Opposite outcomes. How? Why? And most importantly -- what separates the genius from the madman when both are using leverage?
The gap between these two outcomes is not luck. It is not intelligence -- Hwang was extraordinarily intelligent, a protege of one of the greatest hedge fund investors of all time. It is not even work ethic or research quality. The gap is something more subtle and more dangerous: the difference between leverage that gives you time to survive a temporary setback and leverage that removes all your options the moment conditions shift. Understanding that distinction is the entire point of this article.
This is not a simple question, and anyone who gives you a simple answer is either lying or selling something. Financial leverage is one of the most powerful -- and most dangerous -- tools in all of finance. It has built empires. It has destroyed them. It funded the Industrial Revolution. It triggered the 2008 financial crisis. It is used by Apple, Amazon, and every major bank on earth. And it has wiped out Nobel Prize winners.
This article takes the debate seriously. We are going to hear from both sides -- the pro-leverage camp and the anti-leverage camp -- and we are going to let the data judge. Side 1 says leverage is a multiplier: used correctly, it turns modest capital into extraordinary wealth. Side 2 says leverage is a trap: it amplifies not just gains but losses, and when things go wrong -- as they always eventually do -- it does not just hurt you, it destroys you completely and permanently.
Warren Buffett once said: "Only when the tide goes out do you discover who has been swimming naked." That quote is almost entirely about leverage. When markets are rising, everyone using borrowed money looks like a genius. The leverage is invisible. The risk feels theoretical. But when conditions reverse -- even briefly, even mildly -- the naked swimmers are suddenly very visible.
George Soros, the man who broke the Bank of England with a leveraged bet, offers a different lens: "It's not whether you're right or wrong, but how much you make when right and how much you lose when wrong." Soros is not anti-leverage. He used it his entire career. But his quote reveals the truth at the heart of this debate: leverage is an amplifier. It magnifies BOTH sides. The question is whether you have the skills, the timing, and the discipline to survive the losing moments.
Consider the institutional reality: leverage is not a fringe concept used by rogue traders and reckless gamblers. It is embedded in the foundation of the global financial system. Every commercial bank in the world operates with leverage -- typically 8:1 to 12:1 or higher. Every mortgage is a leveraged investment. Every corporate bond issuance adds leverage to a company's balance sheet. Government borrowing is sovereign leverage. If leverage were simply destructive, the entire modern economy would be impossible. Something more nuanced is happening, and we are going to find out exactly what it is.
By the time you finish this two-part series, you will have a complete picture. Part 1 builds the intellectual battlefield -- definitions, the strongest arguments for leverage, the strongest arguments against it, the neutral data that reveals uncomfortable truths, and a fair critique of both sides. Part 2 delivers the final verdict, the practical framework, and what all of this means for investors in 2025 and 2026. But right now, before we argue anything, we need to agree on what we are actually talking about.
One more thought before we proceed. This article will not tell you whether to use leverage. That is your decision, based on your specific circumstances, your capital, your risk tolerance, and your investment horizon. What this article WILL do is give you the complete picture -- every argument, every counterargument, every data point, and every critical nuance -- so that whatever decision you make, you make it with full information rather than half-truths. That is rare in financial media. Most articles either cheerleadfor leverage or scare you away from it. This one will do neither. It will simply tell you the truth and let you decide.
Leverage means different things in different contexts. In everyday language, leverage means influence or advantage. In finance, it has a precise meaning: using borrowed capital to increase the potential return of an investment. If you have $100 and you borrow $400 to invest $500, you are using 5:1 leverage. Simple. Powerful. And as we are about to see, absolutely loaded with consequences. Let us define it properly before the debate begins.
Financial Leverage in 30 Seconds -- Definition and Core Concepts
Financial leverage, at its most fundamental, is the use of borrowed money to amplify investment returns. You put in some of your own capital, you borrow the rest, and you invest the total sum. If the investment earns more than the cost of borrowing, the difference flows back to you as amplified profit. If the investment loses money -- or earns less than the borrowing cost -- the pain is similarly amplified. The mechanism is symmetric in theory. In practice, as we will see, the downside tends to be far more brutal than the upside is generous.
There are three core formulas every investor needs to know. First: Leverage Ratio = Total Assets / Equity. This tells you the multiplier on your capital. If you have $100K equity and $500K in total assets (including $400K borrowed), your leverage ratio is 5x. Second: Debt-to-Equity Ratio (D/E) = Total Debt / Shareholders' Equity. This is how analysts measure corporate leverage -- a D/E of 2.0 means $2 of debt for every $1 of equity. Third: Degree of Financial Leverage (DFL) = % Change in EPS / % Change in EBIT. This measures how sensitive earnings per share are to changes in operating income -- the higher the DFL, the more volatile the company's earnings relative to its operations.
Why do companies and investors use leverage so persistently despite its risks? The answer lies in a concept called capital efficiency. If you can generate a 15% return on capital and debt costs you only 7%, then every dollar of debt you deploy earns an 8% spread for your equity holders. Without leverage, your equity must do all the work. With leverage, your equity does less work but earns more -- because the borrowed capital is also working for you at a profit. This is the engine that drives corporate finance, real estate investing, and private equity. Capital efficiency is not just a preference -- for professionally managed funds with return targets of 15-20%, it is a mathematical necessity.
The Simplest Analogy
Here is the clearest possible example. You have $100,000 in equity. You borrow $400,000 from a bank at 5% interest and buy a property worth $500,000 -- that is 5:1 leverage. Now the property rises 20% in value to $600,000. Your gain is $100,000 -- which is 100% return on your $100K equity. Without leverage, a 20% gain on $100K gives you $20,000 -- a 20% return. Leverage turned a 20% market move into a 100% personal return. That is the magic.
But now flip it. The property drops 20% to $400,000. Your loss is $100,000 -- which is your ENTIRE equity, wiped out completely. Without leverage, a 20% drop on $100K costs you $20,000 -- painful but survivable. With leverage, the same 20% market move means total personal ruin. The bank still wants its $400,000 back regardless of what the property is worth. This asymmetry -- where leverage amplifies both gains and losses equally but the emotional and financial consequences of losses are far worse -- is the central tension of this entire debate.
The flip side of this real estate example deserves equal attention, because the numbers are just as stark. If you bought that $500,000 property with 5:1 leverage and the market corrects 30% -- a correction that has actually occurred in many US markets and is common in emerging market real estate -- your $500,000 asset is now worth $350,000. Your debt is still $400,000. You are now $50,000 underwater: your equity is not zero, it is negative. You owe more than your asset is worth. This is called negative equity, and millions of American homeowners experienced it between 2008 and 2012. They could not sell without writing a check. They could not refinance without additional capital. They were trapped by the exact same leverage that had made them look wealthy two years earlier.
Types of Leverage
Finance recognizes three main types. Operating leverage refers to the proportion of fixed versus variable costs in a business. A company with high fixed costs (like an airline or a semiconductor fab) has high operating leverage -- small revenue changes produce large profit swings. Financial leverage is what this article is about: debt in the capital structure. Combined leverage -- also called total leverage -- multiplies both effects. A company with high operating leverage AND high financial leverage is an amplification machine in both directions. For investors, understanding all three is essential, but financial leverage is the one with the most direct personal consequences.
Key Ratios -- What Healthy Looks Like
The Debt-to-Equity ratio is the most watched. Below 1.0 is generally conservative. Between 1.0 and 2.0 is moderate. Above 3.0 raises red flags in most industries (though banking and real estate are structural exceptions). The Debt-to-Assets ratio measures what percentage of assets are debt-financed -- below 50% is often considered safe. The Interest Coverage Ratio (EBIT / Interest Expense) is critical: below 1.5x means the company is struggling to pay its interest from operating earnings alone, which is a serious warning sign. Above 3x is healthy. These numbers are not absolute rules -- context matters enormously -- but they give investors a starting framework for evaluating leverage risk.
| Ratio | Formula | Healthy Range | Danger Zone | Example (2025) |
| Leverage Ratio | Total Assets / Equity | 2x - 4x | Above 10x | Bank of America: ~11x (normal for banks) |
| Debt-to-Equity (D/E) | Total Debt / Equity | 0.5x - 2.0x | Above 4x | Apple: ~1.8x (strategic) |
| Debt-to-Assets (D/A) | Total Debt / Total Assets | Below 50% | Above 70% | Utilities: ~55% (acceptable) |
| Interest Coverage | EBIT / Interest Expense | Above 3x | Below 1.5x | Microsoft: ~45x (very safe) |
| Degree of Financial Leverage (DFL) | % Change EPS / % Change EBIT | 1.0x - 2.0x | Above 5x | Highly leveraged PE buyouts: 3x-6x |
Note: Industry context changes everything. Banks operate at leverage ratios that would be catastrophic in other sectors due to the nature of deposit funding. Always compare leverage ratios within the same industry, not across sectors.
One concept that deserves special attention before we enter the debate is the difference between leverage that is called versus leverage that is patient. A 30-year fixed-rate mortgage cannot be called early by the bank. If your home drops in value, the bank does not demand immediate repayment -- you simply keep making monthly payments and wait for the recovery. This is patient leverage. A margin loan from a brokerage, on the other hand, can be called the moment your portfolio drops below the maintenance margin threshold. This is called leverage. Almost every catastrophic leverage failure in history -- LTCM, Archegos, Lehman -- involved callable leverage meeting a sudden market decline. The structure of the borrowing matters as much as the amount.
These ratios tell you where a company or investment stands on the leverage spectrum. But they tell you nothing about whether that position is wise -- because the wisdom of leverage depends entirely on what you do with the borrowed money, how stable your cash flows are, and what market conditions look like when you need to refinance or exit. That is the nuance both sides in this debate tend to ignore when it suits them. Let us now hear Side 1 make its strongest possible case.
The Case FOR Leverage -- Profit Multiplier (Side 1)
The pro-leverage camp does not lack for ammunition. If you look at the greatest wealth creation stories of the past century -- real estate empires, private equity buyouts, corporate expansions, sovereign infrastructure -- almost all of them share one common ingredient: borrowed money used strategically. Side 1 does not claim leverage is risk-free. It claims leverage, used intelligently, is the most powerful wealth accelerator available to investors. Here are their five strongest arguments.
Before we present Side 1's arguments, a framing note: we are being genuinely rigorous here. We are presenting the strongest possible version of the pro-leverage case -- not a strawman that is easy to knock down, but the actual arguments made by sophisticated investors, Nobel Prize-winning economists, and the financial institutions that have used leverage most successfully. You deserve to hear the best case for each position, not a caricature. Side 2 will receive the same treatment. Only then can you make an informed judgment.
Argument 1 -- Return Amplification (Mathematical Proof)
Let us walk through the math slowly and carefully. You have $100,000 in equity. Scenario A: no leverage. You invest $100,000 at a 15% annual return. After one year you have $115,000 -- a $15,000 profit, 15% return. Solid, but unremarkable.
Scenario B: 3:1 leverage. You borrow $200,000 at 8% annual interest and invest the full $300,000 at the same 15% return. Your gross return is $45,000. Your interest cost is $200,000 x 8% = $16,000. Net profit: $45,000 - $16,000 = $29,000. Your return on your original $100,000 equity: 29% versus 15% without leverage. You nearly doubled your return without finding a better investment -- just by using borrowed capital efficiently. The investment itself did not change. The return did.
This is not magic. It is arithmetic. The key assumption is that the investment return (15%) exceeds the cost of borrowing (8%). When that spread is positive and consistent, leverage is mathematically beneficial. The larger the spread and the higher the leverage ratio, the more dramatic the amplification. This is why sophisticated investors obsess over the cost of their capital -- because cheaper debt means a wider spread and a more powerful leverage effect.
The technical term for this dynamic is positive financial leverage. It exists when Return on Assets (ROA) exceeds the after-tax cost of debt. When ROA is 12% and debt costs 7% after tax, every dollar of borrowed capital earns a 5% spread for equity holders. With $200,000 of borrowed capital, that is $10,000 per year in pure arbitrage profit on top of your equity returns. Now scale that to a corporation borrowing $5 billion at 4% to invest in assets generating 14% ROA and you can see why the CFOs of Apple, Microsoft, and Johnson & Johnson are not paying down their debt -- they are deliberately maintaining it.
Importantly, the amplification effect of leverage is not linear -- it is multiplicative. Moving from 1:1 to 2:1 leverage does not simply add one unit of amplification. It doubles your exposure. Moving from 2:1 to 5:1 does not add three more units -- it more than doubles your exposure again. This compounding nature of leverage amplification means that small increases in leverage ratio can produce dramatically larger risk and reward profiles than intuition suggests. A trader who moves from 3:1 to 5:1 leverage is not adding a modest 67% more risk. They are entering a materially different risk regime where the same adverse move that previously hurt badly will now potentially wipe them out entirely.
Consider also the Kelly Criterion, a mathematical formula developed by Bell Labs scientist John Kelly in 1956 and widely used by professional gamblers and sophisticated investors. The Kelly Criterion calculates the optimal fraction of capital to risk given the probability of winning and the payoff ratio. What is remarkable about the Kelly formula is that it mathematically proves leverage has a precise optimal point -- and that going beyond that point reduces expected long-run wealth even when each individual bet is positive expected value. This is a stunning result: you can have a winning strategy and still destroy your wealth by using too much leverage. The Kelly formula effectively proves that there is a mathematical ceiling on how much leverage is optimal -- and most overleveraged investors have blown far past it.
Argument 2 -- Real Estate: Leverage's Greatest Success Story
No asset class demonstrates the power of leverage better than real estate -- and no story makes that case better than Sam Zell. Starting in the early 1990s, when the US real estate market was in ruins following the savings and loan crisis, Zell used leveraged purchases of distressed commercial properties to build what would become a $39 billion empire. He bought assets nobody wanted, financed them with debt, improved or stabilized them, and then either held them for cash flow or sold into recovering markets. Leverage was not incidental to his strategy -- it WAS his strategy.
The numbers for ordinary homebuyers are equally compelling. An American who bought a median-priced home in 2012 with a standard 20% down payment (5:1 leverage) and held it through 2025 saw their home value appreciate roughly 80%. On a 5:1 leveraged purchase, that 80% market gain translates to approximately a 400% return on the equity invested. Without leverage, that same homebuyer would have simply earned 80%. Leverage turned an 80% market return into a 400% personal return -- and millions of American families built their primary wealth this way. The US middle class, in large part, was built on a leveraged instrument called the mortgage.
It is not just individual investors. BlackRock, Brookfield Asset Management, and Blackstone -- three of the largest asset managers on earth with a combined AUM exceeding $25 trillion -- all use leverage as a fundamental and intentional tool in their real estate and infrastructure portfolios. This is not recklessness. It is institutional discipline with borrowed capital.
Argument 3 -- Corporate World: Nearly Every Major Company Uses Leverage
Consider Apple Inc. in 2025. Apple carries over $100 billion in total debt despite sitting on more than $160 billion in cash and equivalents. Why would the most valuable company in history borrow money it does not need? Simple: Apple can borrow at roughly 3-4% while its invested capital earns 15% or more in returns. That spread -- 11-12 percentage points of pure arbitrage -- compounds across billions of dollars and creates enormous shareholder value. Apple's debt is not a sign of weakness. It is a sign of financial sophistication.
Then there is Amazon. Jeff Bezos used debt aggressively throughout the 2000s and 2010s to fund warehouse construction, last-mile logistics infrastructure, and the early development of AWS. Critics at the time called Amazon reckless and over-leveraged. In hindsight, every dollar of debt used to build AWS infrastructure returned hundreds of dollars in value. Without leverage, Amazon might still be a mid-sized online retailer. Leverage funded the transformation into a $2 trillion global technology company.
The numbers from the private equity world are especially instructive for anyone who wants to understand what disciplined leverage can achieve. Bain & Company's Global Private Equity Report 2025 documents that the top-quartile PE firms have delivered average net IRRs of 17-22% annually over the past decade -- returns that comfortably exceed public equity markets. The majority of that outperformance is attributable to three factors: operational improvement, strategic repositioning, and leverage. Without the leveraged buyout structure, PE firms would be paying with more of their own equity, reducing returns proportionally. The industry's entire value creation model depends on leverage being used at the right level, on the right assets, with sufficient cash flow coverage.
Private equity firms take this logic to its extreme. KKR, Blackstone, and Apollo Global Management built their entire business model on leveraged buyouts (LBOs) -- acquiring companies by funding 60-70% of the purchase price with debt. The equity return is amplified because the debt does the heavy lifting. KKR's buyout of RJR Nabisco in 1989 (then the largest LBO in history at $31.4 billion) was funded with approximately 93% debt. Over the years, PE firms have delivered average net returns of 14-18% annually -- returns that would be impossible without leverage.
The Blackstone real estate model deserves a closer look because it demonstrates leverage discipline at institutional scale. Blackstone's real estate funds typically target loan-to-value ratios of 55-65% on core acquisitions -- meaningful leverage, but with substantial equity cushion. They focus on assets with long-term leases and creditworthy tenants that generate predictable, inflation-linked cash flows to service the debt. They maintain floating-rate debt hedges to manage interest rate exposure. And they have diversified portfolios across property types and geographies so that no single market collapse can destroy the fund. This is not Hwang-style concentrated leverage in volatile assets. It is disciplined institutional leverage applied to income-producing hard assets with long cash flow visibility. The difference in approach is the difference between a bridge and a tightrope.
Argument 4 -- Tax Shield
One of the most technically rigorous arguments for leverage comes from academic finance. Interest payments on debt are tax-deductible in most jurisdictions, which means borrowing creates a tax shield that effectively lowers the real cost of debt. Example: a company with $1 million in annual interest expense and a 25% corporate tax rate saves $250,000 in taxes that an all-equity company would pay. The net cost of that $1 million in interest is only $750,000 after the tax benefit. This insight is the foundation of the Modigliani-Miller theorem, developed by Franco Modigliani and Merton Miller -- both Nobel Prize winners -- which formally proved that in a world with taxes, debt financing creates real value through the tax shield. It is not just intuition; it is Nobel Prize-winning economics.
The tax shield argument gains even more power when you factor in inflation dynamics. When you borrow at a fixed rate and inflation runs higher than expected, the real cost of your debt shrinks over time. A company that borrowed $1 billion at 4% fixed in 2020 found that by 2023, with inflation running at 8-9%, the real cost of that debt had become negative -- inflation was eroding the debt burden faster than the nominal interest was accumulating it. This is why companies with large fixed-rate debt loads can actually benefit from inflationary environments, provided their revenues also rise with inflation. Real assets funded by fixed-rate debt in inflationary periods represent some of the most powerful wealth-building situations leverage can create.
Argument 5 -- The Legends Prove It
September 16, 1992. George Soros bets $10 billion in leveraged positions against the British pound, believing the UK cannot maintain its exchange rate within the European Exchange Rate Mechanism. The Bank of England spends over $27 billion trying to defend the pound. They fail. The UK is forced to withdraw from the ERM. Soros makes approximately $1 billion in a single day. This trade -- one of the most famous in financial history -- was built entirely on leverage. Without borrowed capital amplifying his position, the profit would have been a fraction of what it was. Leverage turned a correct macro bet into a legendary trade.
| Investor / Company | Leverage Used | Return / Outcome | Key Lesson |
| Chamath Palihapitiya (2020) | Options + leveraged positions | ~10x in 18 months | Leverage in a recovery + conviction = explosive gains |
| George Soros (1992) | ~$10B leveraged FX bet | $1B profit in one day | Leverage amplifies correct macro calls massively |
| Sam Zell (1990s-2000s) | High leverage on distressed RE | $39B empire built | Leverage on cheap distressed assets = compounding wealth |
| Apple Inc. (2025) | $100B+ debt vs $160B+ cash | 3-4% borrow vs 15%+ earn | Debt arbitrage creates billions in shareholder value |
| Blackstone Real Estate | Core RE LBO leverage | Consistent 15-20% returns | Institutional leverage with discipline = repeatable alpha |
| US Homebuyers (2012-2025) | 5:1 via 20% down mortgage | ~400% equity return | Mortgage leverage built the American middle class |
| KKR / PE Industry | 60-70% debt in LBOs | 14-18% net annual returns | LBO model proves leverage + operational improvement works |
Note: These are selected success stories. Survivorship bias is real -- far more leveraged bets fail quietly without making financial headlines. Side 2 will address this directly.
The corporate leverage success story extends well beyond the obvious giants. Look at Delta Air Lines. After emerging from bankruptcy in 2007, Delta used careful, strategic leverage to acquire Northwest Airlines and build one of the most profitable carriers in aviation history. By 2019, Delta had generated over $5 billion in annual free cash flow -- returns that would have been impossible with a purely equity-funded balance sheet. Similarly, T-Mobile's leveraged merger with Sprint in 2020 -- financed with approximately $32 billion in debt -- created a genuine competitor to Verizon and AT&T that drove down consumer prices across the US telecommunications market. The leverage was large, the risk was real, and the strategic outcome was transformative. These are not outlier stories -- they are mainstream corporate finance in action.
There is one more dimension of the pro-leverage case that is often missed in popular financial commentary: the role of leverage in economic development at a national scale. The construction of US interstate highways in the 1950s was debt-financed. South Korea's industrial miracle from 1965-1995 was built on government-directed credit allocation -- leveraged investment in heavy industry and manufacturing that turned a war-ravaged country into an economic powerhouse. Singapore's port and financial infrastructure was financed with borrowed capital. China's Belt and Road initiative, whatever its controversies, is leverage deployed at civilizational scale. Dismissing leverage is, in a very real sense, dismissing the financial mechanism that built the modern world.
The pro-leverage argument is powerful, documented, and backed by some of the most successful investors and companies in history. The math works. The tax benefits are real. The empirical track record of real estate, private equity, and strategic corporate borrowing spans decades. It is genuinely difficult to dismiss. But Side 2 has been sitting here the entire time, arms crossed, waiting to show you the other half of the story -- the half that is just as well-documented and far more terrifying.
The Case AGAINST Leverage -- The Destruction Trap (Side 2)
Side 2 is not a group of timid, risk-averse people who simply prefer to play it safe. Side 2 includes some of the most brilliant financial minds in history -- people who understood leverage deeply, used it carefully for years, and still watched it destroy them or those around them. Their argument is not that leverage is always bad. Their argument is that leverage is irreversible on the downside in a way that has no equivalent on the upside. Here are their six most powerful arguments.
Before we proceed: a framing note for Side 2 as well. We are presenting the most rigorous, empirically grounded version of the anti-leverage case. Not the reflexive 'debt is scary' advice of personal finance books aimed at households struggling with credit card debt -- but the actual arguments made by serious institutional investors, regulators, and financial historians who have studied the role of leverage in systemic risk and individual investment outcomes. This is an argument that deserves to be heard at its most powerful, because the strongest version of Side 2's case is genuinely disturbing.
There is also a final introductory point worth making: leverage does not care whether you are smart. This is perhaps the most important thing Side 2 wants you to understand. Scholes and Merton were smarter than you. Hwang was smarter than almost all of us. The teams at Lehman Brothers had more financial expertise than any retail investor will ever have. Intelligence is not the variable that determines leverage outcomes. Timing, position size, asset quality, liquidity structure, and the behavior of markets you cannot control are the variables. And no amount of intelligence protects you when all of those variables move against you simultaneously.
Argument 1 -- Losses Are Amplified Too (The Horror Math)
The same mathematics that makes leverage wonderful on the upside makes it catastrophic on the downside. Let us revisit our $100,000 equity investor, now using 3:1 leverage ($300,000 invested, $200,000 borrowed at 8%). But this time the investment loses 15% instead of gaining. The gross loss is $300,000 x 15% = $45,000. Interest still owed: $200,000 x 8% = $16,000. Total damage: $61,000 on $100,000 equity -- a 61% destruction of capital from a 15% market move. Without leverage, a 15% loss on $100K costs you $15,000. Painful but recoverable. With 3:1 leverage, the same 15% market move nearly eliminates your entire investment. Go to 5:1 leverage and a 20% market drop wipes you out completely -- and you still owe the debt.
Argument 2 -- Archegos: $20 Billion Destroyed in 48 Hours
Bill Hwang grew up poor in South Korea, came to the United States, and eventually found his way to Julian Robertson's Tiger Management -- one of the greatest hedge funds of its era. Hwang learned from the best. He was smart, disciplined, and genuinely talented. After leaving Tiger he ran Tiger Asia, was investigated by the SEC for insider trading, and paid a settlement. Most doors on Wall Street closed to him. So he opened a family office: Archegos Capital Management.
It is worth pausing on the horror arithmetic of Argument 1 for a moment, because most investors do not feel the full weight of it until they run the numbers themselves. Take 5:1 leverage -- 20% equity, 80% debt. The investment needs to drop only 20% to wipe out your entire equity. But a 20% market decline is not an extreme event. It is not a black swan. The S&P 500 has experienced over 20% drawdowns in 2000-2002, 2007-2009, 2020, and 2022. That is four times in 22 years -- roughly once every five years, on average. Anyone using 5:1 leverage in equities should expect, statistically, to face a potential total wipeout scenario approximately once per decade. That is not a risk profile. That is a countdown timer.
What made Archegos unusual was how Hwang built his positions. Rather than buying stocks directly, he used total return swaps -- agreements with prime brokers where the bank technically owned the shares but Hwang received all the economic exposure (gains and losses). This structure had two consequences: it allowed him to take positions far larger than his capital suggested, and it hid those positions from public regulatory filings. No single bank could see the full picture. Hwang had multiple prime brokers simultaneously -- Goldman, Morgan Stanley, Credit Suisse, Nomura, Deutsche Bank -- each seeing only their own slice.
By early 2021, Hwang had built positions in stocks like ViacomCBS, Discovery, and Chinese tech names worth approximately $100 billion in total exposure on roughly $20 billion in equity -- effective leverage of 5:1 to 8:1. Then in March 2021, ViacomCBS announced a secondary stock offering. The stock dropped. Margin calls began. And what happened next was a financial demolition derby: each prime broker, realizing the scale of the collapse, raced to liquidate their Hwang positions before the others could. The selling caused further price drops. The drops triggered more margin calls. In 48 hours, $20 billion in equity was gone. Credit Suisse alone lost $5.5 billion -- a loss so large it contributed materially to the bank's eventual collapse in 2023. Hwang was later convicted of fraud and racketeering in July 2024.
The speed at which the Archegos demolition derby unfolded reveals a fundamental truth about leveraged markets: liquidity is a mirage that disappears exactly when you need it most. When Archegos's brokers began selling, the stocks they were selling dropped rapidly because there were not enough buyers at existing prices to absorb the volume. The leverage that had worked in calm markets became impossible to unwind in a disrupted market. This is a recurring theme across all leveraged disasters: the assumption that you can exit gracefully when conditions change is almost always wrong. Markets freeze, spreads widen, counterparties refuse to trade, and what seemed like a liquid position becomes a trapped position with no exit.
The Archegos collapse also destroyed the careers and reputations of senior bankers at several institutions who had signed off on the total return swap arrangements. Credit Suisse's prime brokerage head resigned. Risk management teams were restructured. The bank's reputation -- already damaged by a series of prior scandals -- never fully recovered, contributing to its eventual forced merger with UBS in March 2023, just two years later. A single leveraged client with hidden positions brought down one of Switzerland's oldest and most storied financial institutions. This is the collateral damage of leverage: it does not just hurt the person who took the leverage -- it spreads.
Argument 3 -- LTCM: Even Nobel Laureates Could Not Survive
If the Archegos story makes you think leverage failures require bad actors, consider Long-Term Capital Management. Founded in 1994 by John Meriwether and staffed by some of the most credentialed financial minds ever assembled -- including Myron Scholes and Robert Merton, co-developers of the Black-Scholes options pricing model and 1997 Nobel Prize winners in Economics -- LTCM was considered the epitome of sophisticated, scientifically rigorous investing. Their models were state-of-the-art. Their track record from 1994-1997 was extraordinary. Their strategy was elegant: exploit tiny pricing inefficiencies in global fixed-income markets, amplified by massive leverage.
At peak, LTCM operated at approximately 25:1 leverage -- $125 billion in assets on roughly $5 billion of equity, with off-balance-sheet derivatives exposure of over $1 trillion notional. Then in August 1998, Russia defaulted on its debt. Markets moved in ways LTCM's models considered essentially impossible. Correlations that were supposed to be low suddenly spiked to 1.0 -- everything fell together. LTCM lost $4.6 billion in less than four months. The Federal Reserve had to organize a $3.6 billion emergency bailout by 14 major banks to prevent LTCM's collapse from triggering a global financial meltdown. The most brilliant quantitative investors of their generation, using Nobel Prize-winning models, were destroyed by leverage.
Long-Term Capital Management also illustrates the danger of model-dependent leverage. LTCM's entire strategy rested on the assumption that historical correlations would hold in the future. When Russia defaulted -- an event that LTCM's models assigned an extremely low probability -- the correlations that underpinned their risk management simply ceased to exist. Every position they held moved against them simultaneously. The models that had been validated against decades of historical data failed in a single month. This is not a failure of intelligence -- it is a fundamental limitation of using historical data to predict future risk when leverage is involved. The past does not reliably predict tail events, and tail events are exactly when leverage kills you.
Argument 4 -- 2008: Leverage Destroyed the World Economy
What makes the LTCM story so instructive is not just that it failed -- it is that it failed despite being designed with extraordinary sophistication. Scholes and Merton had built mathematical models of extraordinary elegance. Their risk management was the state of the art. They had former Federal Reserve vice chairman David Mullins on their team. They had access to capital markets that no other hedge fund could match. And yet, when Russia defaulted in August 1998, the models produced outputs that were essentially impossible according to historical data. The correlations that LTCM's risk models treated as near-zero moved to 1.0 simultaneously. Every position they held moved against them at the same time. The technical term for this is tail risk convergence -- and it is the nightmare scenario of all leveraged investors. When tail risk events occur, diversification fails and leverage kills.
The 2008 financial crisis is the most important case study in leverage history, because it demonstrates what happens when leverage becomes systemic. By 2007, major US investment banks were operating at 30:1 to 40:1 leverage ratios. Lehman Brothers was at roughly 31:1. Bear Stearns was at 33:1. These banks had financed mortgage-backed securities with short-term debt that needed constant rolling over. The mortgages themselves were often issued to borrowers who could not afford them -- another layer of leverage at the consumer level.
When US housing prices declined just 3-5% from their 2006 peaks -- a move that would be noise in an unleveraged portfolio -- the leveraged financial system began to crack. Bear Stearns collapsed in March 2008. Lehman Brothers filed for bankruptcy in September 2008 -- the largest bankruptcy in US history. AIG required a $182 billion government bailout. The US GDP contracted by 2.1%. 8.7 million Americans lost their jobs. Global equity markets lost approximately $37 trillion in value. The entire 2008 financial crisis -- the worst since the Great Depression -- was, at its core, a leverage crisis. Not a technology bubble. Not a fraud scandal. Leverage.
Argument 5 -- Margin Calls: The Most Terrifying Phone Call in Finance
There is a specific mechanism that makes leverage uniquely brutal: the margin call. When you use leverage through a broker, your borrowed positions require maintenance margin -- a minimum collateral value. If your portfolio drops below that threshold, the broker calls you and demands you either add capital or they will liquidate your positions immediately, at current market prices, whether those prices make sense or not. This is the trap within the trap: leverage forces you to sell at exactly the worst possible moment.
COVID March 2020 is the perfect illustration. In those terrible weeks when markets dropped 34% in 33 days, margin calls cascaded across global markets. Leveraged investors who had been profitable for years were forced to liquidate positions at 30-40% losses -- exactly when fundamentally cheap assets were becoming available. The unleveraged investor could hold on, or even buy more. The leveraged investor had no choice. Billions of dollars were destroyed not because the investments were wrong, but because leverage removed the ability to wait. This is the margin call trap: it converts temporary volatility into permanent loss.
The cruelest element of the margin call mechanism is its self-reinforcing nature. When you are forced to sell into a falling market, your selling pushes prices down further. Other leveraged investors hit their own margin thresholds and are forced to sell. Their selling pushes prices down further still. This cascading dynamic -- technically called a deleveraging spiral -- is what turns a normal market correction into a financial crisis. It happened in 1929. It happened in 1987. It happened in 1998 with LTCM. It happened in 2008. It happened in March 2020. Every single time, leverage was the amplifier that turned a manageable decline into a catastrophe. The spiral only ends when leverage is sufficiently reduced -- either voluntarily or through forced liquidation.
Sophisticated risk managers call this sequence a 'fire sale externality' -- because when one leveraged institution is forced to dump assets, it imposes costs on every other market participant through lower prices. This is what makes excessive leverage not just a personal risk but a systemic risk that affects people who are not even using leverage themselves. Pensioners, savers, and unleveraged investors all suffered in 2008 because the leveraged institutions created a fire sale that destroyed asset values across the entire financial system. This is the externality that regulators like the Fed and BIS worry about most when they study aggregate leverage levels.
Argument 6 -- Buffett's Warning (And What It Really Means)
Warren Buffett has been remarkably consistent on this topic for decades. His most direct statement: "Leverage is the only way a smart person can go broke." Think about what that sentence means. Not a reckless person. Not a fraudster. Not an ignorant person. A smart person. Buffett is saying that leverage is precisely dangerous because it creates scenarios that intelligence alone cannot save you from -- liquidity crises, forced selling, margin calls. Being right is not enough if leverage kills you before the market acknowledges you are right.
Charlie Munger, Buffett's longtime partner, was even more blunt: "There are three ways to go broke: liquor, ladies, and leverage." The joke is memorable. The warning is serious. Munger and Buffett have watched brilliant people -- people smarter than them by many measures -- be destroyed by leverage repeatedly across their 60+ year careers. Their anti-leverage stance is not theoretical. It is the product of witnessing the full cycle of leverage stories, including all the ones that do not make it into the success story highlight reels.
| Entity | Leverage Used | Loss | Year | Consequence |
| LTCM | ~25:1 | $4.6B in 4 months | 1998 | Fed-organized $3.6B bailout; firm dissolved |
| Lehman Brothers | ~31:1 | $691B in assets (bankruptcy) | 2008 | Largest US bankruptcy; triggered global crisis |
| Bear Stearns | ~33:1 | $2 hedge funds collapse; firm sold for $2/share | 2008 | Bought by JPMorgan for near-zero |
| Archegos Capital | ~5x-8x via TRS | $20B equity gone in 48 hours | 2021 | Credit Suisse -$5.5B; Nomura -$3B; Hwang convicted |
| Barings Bank | Unauthorized leverage in futures | $1.3B loss | 1995 | 230-year-old bank destroyed by one trader |
| Three Arrows Capital (3AC) | ~10x+ in crypto | $10B+ losses | 2022 | Collapsed; liquidated; contagion across crypto |
Note: These represent only the most famous failures. Thousands of smaller leveraged failures occur every market cycle without making international headlines. The common thread in all six cases: leverage was manageable until it was not, and the transition from manageable to catastrophic was extremely fast.
There is a pattern worth naming explicitly across all six disasters in the table above. In every single case, the leverage worked beautifully for an extended period. LTCM delivered extraordinary returns for four years before collapsing. Lehman grew into a global investment bank powerhouse for decades before its leverage ratio became fatal. Archegos generated enormous wealth for Hwang and his family for years before the margin calls arrived. Barings Bank had survived 230 years before one trader's leveraged positions ended it. This is what makes leverage so treacherous -- it does not fail quickly and obviously. It succeeds seductively, then fails catastrophically. The destruction, when it arrives, is sudden and total.
Side 2 has now made its case with equal force. Nobel laureates destroyed. A 230-year-old bank erased. The world economy nearly collapsed. Billions gone in 48 hours, 48 weeks, four months. These are not edge cases or bad luck. They are recurring patterns that appear in every financial era, in every market, across every asset class where leverage is used without adequate margin for error. Both sides have spoken. Now it is time to leave the courtroom and enter the laboratory. What does neutral data actually say?
The Evidence Exam -- What Does the Data Say?
Both sides in this debate have a favorite technique: cherry-picking. The pro-leverage camp highlights Soros, Chamath, and Blackstone. The anti-leverage camp highlights Archegos, LTCM, and Lehman. Neither side is lying. Both sides are incomplete. So let us step back from the stories and look at what systematic, neutral data actually reveals about leverage -- across large samples, over long time periods, across different market conditions.
Neutral analysis means accepting uncomfortable facts that cut against your prior beliefs. If you came into this article convinced leverage is genius, the data will show you failure rates that should give you serious pause. If you came in convinced leverage is madness, the data will show you long-run return profiles that should challenge your assumptions about what 'safety' actually costs you in foregone wealth over decades. True neutral analysis does not validate either camp completely. That is, in itself, an important finding.
The decade from 2015 to 2025 offers perhaps the cleanest natural experiment in leverage outcomes that financial markets have ever produced. It includes a long bull market (2015-2019), a sudden sharp crash and rapid recovery (2020), a high-inflation rate-shock environment (2022), and a subsequent recovery (2023-2025). In other words: almost every possible market condition, compressed into a single decade. This makes it an ideal dataset for testing what different leverage levels actually deliver to real investors who are living through the whole cycle, not just observing the terminal return.
Data Point 1 -- Leveraged vs Unleveraged Returns: S&P 500 (2015-2025)
ProShares Ultra S&P 500 (SSO), a 2x leveraged ETF tracking the S&P 500, delivered approximately 690% cumulative return from 2015 to 2025 versus roughly 250% for the unleveraged S&P 500 over the same period. That sounds like an overwhelming case for leverage. But examine the volatility: SSO experienced drawdowns of over 60% in 2020 and 2022 versus 34% and 25% for the unleveraged index. An investor who needed liquidity in February 2020 or November 2022 was not celebrating the long-term returns -- they were experiencing the volatility decay effect, where daily rebalancing in leveraged ETFs compounds losses in choppy or declining markets. The long-term winner looks great in hindsight. The path to get there requires a stomach most investors genuinely do not have.
There is also the issue of volatility decay -- a mathematical phenomenon that is often overlooked in leverage discussions. When leverage is maintained through daily rebalancing (as in leveraged ETFs), volatility compounds against you in choppy or sideways markets even when there is no net directional loss. A 2x leveraged ETF tracking an index that drops 10% then rises 10% does not return to par -- it loses money. This 'volatility drag' means that leveraged instruments perform significantly worse than their stated multiple in volatile, non-trending markets. Investors who assume 2x leverage always delivers 2x returns are fundamentally misunderstanding the instrument they hold -- and many retail investors in leveraged ETFs have made exactly this mistake.
Data Point 2 -- Failure Rates and Institutional Research
The IMF's Global Financial Stability Report (2025) finds that highly leveraged non-financial firms are 3 times more likely to default during economic downturns compared to their low-leverage peers. This figure is remarkably consistent across regions and economic cycles -- it appeared in the 2001 dot-com bust, the 2008-2009 crisis, the 2020 COVID shock, and the 2022 rate-shock environment. Separately, a 2024 analysis of hedge fund liquidations found that over 70% of blowups involve excess leverage as either the primary cause or a major contributing factor. Leverage does not just increase the severity of failure -- it dramatically increases the frequency of failure.
A 2024 study published in the Journal of Financial Economics examined 2,847 highly leveraged firm events between 1990 and 2023 and found a striking asymmetry: firms in the top leverage quartile outperformed their peers by an average of 4.2 percentage points annually in the three years BEFORE a crisis, then underperformed by 18.7 percentage points in the year OF the crisis. The message is uncomfortable but clear: leverage creates an extended period of apparent outperformance that eventually reverses violently. Investors who observe the first phase and extrapolate it forward are setting themselves up to experience the second phase at maximum exposure.
Data Point 3 -- Industry Leverage Norms: Who Needs It, Who Should Avoid It
Not all industries have the same relationship with leverage. Real estate, banking, utilities, and infrastructure have predictable, stable cash flows that can service debt reliably -- leverage is structurally appropriate and even necessary in these sectors. Technology startups, early-stage companies, and cyclical businesses with volatile revenues face a fundamentally different risk profile. For them, leverage introduces the risk of forced bankruptcy during revenue dips that a unleveraged competitor would simply survive. The 2022 tech selloff illustrated this: leveraged tech startups that could not refinance at higher interest rates were forced into distressed sales or bankruptcy, while their unleveraged or conservatively financed competitors simply adjusted spending and waited for conditions to improve.
The industry norms table above tells an important story about which sectors have built leverage into their fundamental operating model versus which treat it as optional financing. Banking and real estate are structurally leveraged -- you cannot operate a bank without taking deposits (liability leverage) and lending them out (asset leverage). A bank with zero leverage would simply be a vault. The leverage is the business. But for a technology startup with unpredictable revenue, high cash burn, and uncertain profitability timelines, debt creates a fixed obligation that can become fatal in a funding drought. The 2022-2023 startup funding winter demonstrated this vividly: startups that had taken on debt at near-zero interest rates suddenly faced refinancing at 7-9% rates with revenues missing targets. Several dozen went bankrupt. Their unleveraged peers simply raised equity at lower valuations and survived.
Data Point 4 -- The Optimal Leverage Ratio
Academic research in corporate finance has converged on a range of D/E ratios between 0.5x and 1.5x as optimal for most non-financial businesses. Below 0.5x, companies are likely leaving the tax shield benefit on the table and under-optimizing their capital structure. Above 2.0x, the probability of financial distress begins to outweigh the tax and amplification benefits for most industries. A 2023 meta-analysis of corporate finance studies across 40 years of data found that the average firm with D/E between 0.8x-1.2x significantly outperformed both the zero-debt and high-leverage cohorts on risk-adjusted returns over 10-year periods. The sweet spot exists. It is just narrower than either side of this debate admits.
| Industry | Avg D/E 2025 | Optimal Range | Key Risk | Notable Examples |
| Banking / Financial | 8x-12x | 8x-15x (asset-based) | Liquidity runs, credit defaults | JPMorgan, Citi, HSBC |
| Real Estate (REITs) | 1.5x-2.5x | 1.0x-2.5x | Rate rises, vacancy | Prologis, Simon Property, AvalonBay |
| Utilities | 1.5x-2.0x | 1.0x-2.5x | Rate risk, regulation | NextEra Energy, Duke, Dominion |
| Healthcare | 0.8x-1.5x | 0.5x-1.5x | Reimbursement changes | UnitedHealth, CVS, HCA |
| Consumer Staples | 0.5x-1.0x | 0.3x-1.0x | Margin compression | Procter & Gamble, Nestle, Unilever |
| Technology (Large Cap) | 0.5x-1.5x | 0.3x-1.5x | Rate sensitivity, obsolescence | Apple, Microsoft, Alphabet |
| Technology (Startups) | 0.1x-0.5x | 0x-0.3x | Revenue volatility, cash burn | Pre-IPO SaaS, fintech startups |
| Private Equity (LBO) | 3x-5x | 2x-5x (deal-specific) | Cash flow shortfalls, refinance risk | KKR, Blackstone portfolio cos. |
Note: D/E ratios for banking reflect total assets to equity (not traditional D/E), as banks' deposits are technically liabilities but not debt in the traditional sense. Industry norms vary significantly by business model, cash flow stability, and the interest rate environment at the time of borrowing.
| Scenario (Investment Return) | Without Leverage | With 2:1 Leverage (50% debt at 7%) | With 5:1 Leverage (80% debt at 7%) |
| +30% return | +30% on equity | +53% on equity | +122% on equity |
| +20% return | +20% on equity | +33% on equity | +72% on equity |
| +10% return | +10% on equity | +13% on equity | +22% on equity |
| +7% return (= cost of debt) | +7% on equity | +7% on equity (break-even) | +7% on equity (break-even) |
| +3% return | +3% on equity | -1% on equity (loss) | -17% on equity (significant loss) |
| -10% return | -10% on equity | -27% on equity | -78% on equity |
| -20% return | -20% on equity | -47% on equity | -156% on equity (bankrupt) |
| -33% return | -33% on equity | -73% on equity | Total wipeout + debt owed |
Note: Returns calculated on equity invested. 2:1 leverage = 50% equity, 50% debt. 5:1 leverage = 20% equity, 80% debt. Debt cost assumed at 7% annual. A -156% equity return means not only is all equity gone but additional capital is owed to the lender -- the investor is technically insolvent.
One more data point deserves emphasis. The 2025 Federal Reserve Financial Stability Report flagged that total US non-financial sector debt has reached approximately $36 trillion -- representing roughly 130% of GDP. Global non-financial sector debt stands at around $235 trillion, approximately 238% of global GDP according to the Institute of International Finance. These numbers do not mean a crisis is imminent -- economies have operated at high debt-to-GDP ratios before and managed successfully. But they do mean that the aggregate leverage in the global financial system is at or near historical highs, which means the systemic consequences of a leveraged unwind, if it occurred, would be of unprecedented scale. The 2008 crisis happened when global debt-to-GDP was meaningfully lower than today.
The data tells a nuanced story that neither side in this debate fully wants to accept. Leverage works -- until it does not. The returns in rising markets are genuinely superior. The failures in declining markets are genuinely catastrophic. The optimal zone exists but is narrower and more context-dependent than leverage's advocates admit. And the failure rates are higher and more systematic than leverage's critics sometimes credit. Both sides have been presenting real evidence. Both sides have also been exploiting real weaknesses in the other's argument. Let us examine those weaknesses directly.
Where Each Side Falls Short -- A Fair Critique of Both Camps
This is the section that both sides in the leverage debate most want you to skip. Because this is where we hold each side accountable for the arguments they did not make, the evidence they quietly omitted, and the logical gaps they hoped you would not notice. A genuinely informed position on leverage requires understanding not just the strongest arguments for each side -- but the weakest ones too.
Think of this as the cross-examination phase. In a courtroom, the strongest advocates are not the ones who give the most passionate opening statements -- they are the ones who can survive cross-examination with their core arguments intact. Both sides in this debate have given passionate opening statements. Now we ask the hard follow-up questions: Where does your logic break down? What evidence did you not present? What assumption are you hiding that does the most work in your argument? If either side cannot survive these questions, their argument is weaker than it appeared.
Side 1's Weaknesses (The Pro-Leverage Camp)
The pro-leverage camp leads with return amplification, and the math is real. But there is an important unstated assumption in every pro-leverage return calculation: that the investor survives the path to get there. The 2x leveraged S&P 500 ETF that returns 690% over a decade also experiences 60% drawdowns along the way. An investor who needed liquidity at the bottom of those drawdowns -- for medical expenses, job loss, a business emergency -- was not celebrating long-term returns. They were selling at the bottom of a 60% hole. Pro-leverage advocates present the destination without adequately warning about the journey.
The most fundamental problem with Side 1's case is survivorship bias. When they cite Chamath, Soros, Zell, and Blackstone, they are selecting from a universe of leveraged investors that includes thousands of failures for every visible success. We know Chamath's name because he won. We do not know the names of the hundreds of fund managers who used leverage during COVID and were wiped out by the initial crash before the recovery arrived. The winners write books and give conference talks. The losers file quietly for bankruptcy. The selection of examples from Side 1 is not dishonest -- the success stories ARE real -- but it is profoundly incomplete.
The Soros example deserves special scrutiny. Yes, he made $1 billion breaking the Bank of England in 1992. But Soros has also had catastrophic leveraged losses -- including losing approximately $700 million in a single day during the 1987 stock market crash and losing billions in 1999-2000 in technology stocks. His NET career is remarkable, but his leveraged failures are equally instructive and far less frequently mentioned by his admirers. Cherry-picking the 1992 trade while ignoring the 1987 and 2000 disasters gives a fundamentally misleading picture.
Pro-leverage advocates also consistently underweight timing risk. The real estate argument -- 20% down, 80% mortgage, 400% return from 2012-2025 -- is mathematically accurate but depends entirely on buying in 2012 (near the bottom of a historic crash) and holding for 13 years. A homebuyer who used the same 5:1 leverage in 2006 near the peak saw their equity wiped out by 2009. The strategy is the same. The outcome is the opposite. Leverage amplifies timing errors just as powerfully as it amplifies correct timing.
Finally, the tax shield argument has an important hidden assumption: it only benefits companies with stable, positive taxable income. If a company uses leverage, has a bad year, and posts a loss, there is no taxable income to shield. The interest is still owed. The mathematical elegance of Modigliani-Miller exists in a frictionless theoretical world. In the real world, cyclicality, economic downturns, and industry disruptions mean the tax shield is far less reliable than the formula suggests.
Side 2's Weaknesses (The Anti-Leverage Camp)
Side 2 has its own blind spots, starting with the over-reliance on extreme examples. LTCM at 25:1. Lehman at 31:1. These are not representative examples of leverage -- they are examples of insane leverage. The academic research on optimal D/E (0.5x-1.5x) suggests that moderate leverage is not just survivable but genuinely value-creating. Arguing against leverage by citing 25:1 LTCM is like arguing against driving by citing Formula 1 crashes. The extreme is real. The relevance to normal use is deeply questionable.
Side 1 also has a blind spot around interest rate sensitivity. All of the pro-leverage success stories -- real estate returns from 2012-2025, PE outperformance, Apple's debt arbitrage -- were generated in a period of historically low interest rates. The US Federal Funds Rate was at or near zero from 2008-2015 and again from 2020-2022. Borrowing at 3% and earning 15% is a dramatically different proposition from borrowing at 8% and earning 12%. When interest rates rise sharply, as they did in 2022-2023, the leverage math deteriorates rapidly for all asset classes simultaneously. PE firms that loaded portfolio companies with cheap floating-rate debt in 2020-2021 suddenly found their interest coverage ratios crashing as rates tripled. The success stories of the 2010s were partly leverage stories -- and partly low-rate-era stories that may not repeat.
Anti-leverage critics also fall into a peculiar contradiction when they target ordinary investors while ignoring that mortgages ARE leverage and they built the wealth of the American, European, and many Asian middle classes. If Side 2's argument is correct -- that leverage is a trap and a destroyer -- then the 30-year fixed mortgage should be condemned alongside hedge fund leverage. But almost nobody makes that argument, because the evidence for moderate, long-horizon, asset-backed leverage creating middle-class wealth is overwhelming. Side 2 is selective about which leverage it condemns.
Perhaps the most intellectually interesting weakness in Side 2's case concerns Warren Buffett himself. Buffett is frequently cited as the anti-leverage voice of reason -- and his warnings are genuine. But what Side 2 conveniently omits is that Berkshire Hathaway has operated with a form of leverage for decades: the insurance float. Berkshire's insurance subsidiaries (GEICO, General Re, etc.) collect premiums before paying claims -- and Buffett invests that float in equities and businesses. As of 2025, this float exceeds $170 billion. It is effectively free or negative-cost leverage -- Buffett uses other people's money to fund investments, exactly like leverage, but structured so that it is cheap and patient. His anti-leverage statements are sincere warnings about volatile, callable debt. But his entire business model benefits from the most elegant form of leverage ever constructed.
The anti-leverage camp also conflates speculation with investment. LTCM was speculating on fixed-income convergence. Archegos was speculating on concentrated individual stock positions. These are not the same as a utility company financing infrastructure with 40-year bonds or a real estate developer financing income-producing commercial property. Leverage in speculative, volatile, concentrated positions behaves completely differently from leverage in cash-flow-stable, diversified, long-duration assets. Treating them as equivalent is a category error that inflates the apparent risk of responsible leverage.
The anti-leverage camp also overstates the predictability of disaster. The argument implicitly suggests that using leverage inevitably leads to the outcomes experienced by LTCM, Lehman, and Archegos. But millions of businesses carry debt for decades and never experience a financial crisis. The average small business owner who finances a commercial property with a 70% loan-to-value mortgage and generates steady rental income is also using leverage. They are not Archegos. The framing error in anti-leverage arguments is treating all leverage as equivalent to the most extreme examples of leverage misuse.
There is one final weakness in Side 2's position that rarely gets discussed: the opportunity cost of excessive caution. If you spend 30 years avoiding all forms of leverage -- including mortgages, business loans, and educational debt -- while your peers use moderate, disciplined leverage to accumulate assets, the outcome is a significant and permanent wealth gap. A person who bought a home in 2005, survived the 2008 crash with patience, and held until 2025 built substantial wealth through leveraged homeownership -- despite experiencing a terrifying multi-year drawdown. A person who watched from the sidelines in a savings account, avoiding leverage entirely, accumulated far less. Risk-adjusted returns matter. But so does the total absolute return that funds retirement, education, and financial security.
Both sides have fought hard and made real points. And both sides have gaps that a careful reader should notice. The truth about leverage is neither as simple as 'use it and multiply your wealth' nor as simple as 'avoid it and stay safe.' It is more specific, more conditional, and more dependent on the quality of the underlying asset, the cost of debt, the stability of cash flows, and the margin of safety than either camp is comfortable admitting. We have now done the intellectual groundwork. Part 2 will do the practical work.
Coming in Part 2 -- The Verdict, the Framework, and the 2025-2026 Landscape
What both critiques ultimately reveal is that leverage is a tool that requires contextual judgment that cannot be reduced to a simple rule. The pro-leverage camp is right that leverage, used correctly in the right circumstances, is one of the most powerful wealth-building mechanisms available. The anti-leverage camp is right that leverage, misused or overused, creates catastrophic and permanent losses that no amount of intelligence or discipline can reliably prevent once the snowball starts rolling. Neither camp is wrong. Both camps are incomplete. And the space between their positions -- the nuanced, conditional, context-dependent truth about when leverage helps and when it destroys -- is where smart investors actually live.
Part 1 has built the battlefield. We started with two vivid stories -- Chamath's billion-dollar COVID trade and Hwang's 48-hour destruction -- that capture the entire tension of this debate in human terms. We defined leverage precisely, walked through the core formulas and ratios, and then heard two full sets of arguments: Side 1 made the case for leverage as a wealth multiplier with five powerful, evidence-backed arguments. Side 2 made the case against leverage as a destruction trap with six equally powerful, equally evidence-backed arguments. We examined what neutral data actually says -- failure rates, industry norms, optimal ratios, and return scenarios across a full range of market conditions. And we held both sides accountable for their weaknesses.
What we have NOT yet delivered is the final verdict. That requires additional evidence and context that will unfold in Part 2. We will hear from legendary investors -- what Dalio, Lynch, Druckenmiller, and Graham specifically say about leverage and when they have used it versus avoided it. We will walk through a practical leverage calculator so you can stress-test your own specific situation with real numbers. We will examine the 2025-2026 global leverage landscape -- what current interest rates, corporate debt levels, and real estate conditions mean for leverage decisions right now. We will look specifically at the Bangladesh context -- what leverage means for investors and businesses operating in a high-growth frontier market with specific currency and credit dynamics. And we will provide clear, actionable do's and don'ts grounded in everything we have learned.
The final verdict -- Is leverage genius or madness? -- will not be a simple yes or no, because the data does not support a simple answer. But it WILL be a specific, conditional, and actionable answer. The kind of answer that tells you not just what the general principle is, but what YOU should do given your specific capital, goals, risk tolerance, and market environment. That is what Part 2 delivers.
Continue to Part 2: The Final Verdict on Financial Leverage -- where legends speak, the calculator runs, and the debate ends.
Recommended for you

The Bretton Woods Agreement: A Turning Point in Global Economic History
In 1944, as the world was still engulfed in the devastation of World War II, the global economy had collapsed and people’s living standards had plummeted. In an effort to stabilize the international economy and address pressing global financial issues, the Allied nations convened a historic summit. Nearly 730 delegates from 44 countries gathered at the Mount Washington Hotel in Bretton Woods, New Hampshire, for the United Nations Monetary and Financial Conference. The outcome of this summit was the landmark Bretton Woods Agreement, which gave birth to the Bretton Woods System.
Money
Money: What It Is, How It Works, and Its Complete History
Branding
Branding: How to Make Your Business Stand Out

E-Commerce
E-Commerce: The Complete Guide to Online Business

Marketing
The 7 P's of Marketing: The Complete Framework Every Business Needs

Startup
What Is a Startup? The Ultimate Guide You Need to Read

Accounting
Gross Profit: Definition, Formula, and Why It Matters

Accounting
GAAP: What It Is and Why It Matters in Accounting

Accounting
Business Accounting: What It Is and How It Works

Accounting
Four Flavors of Accounting: Tax, Project, Financial, and Cost Accounting Explained