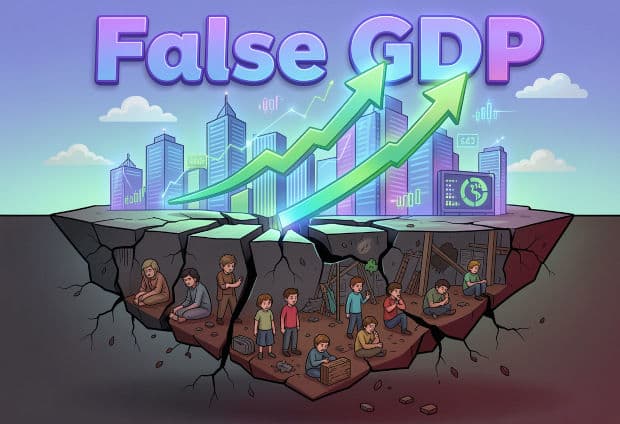
Why GDP Often Paints a False Picture of Development: The Truth Behind the Numbers
G
GeoRenus Editorial Team
472 views
Summary
Gross Domestic Product (GDP) is the total monetary value of all goods and services produced within a country's borders over a specific period -- but does it truly measure how well a nation is doing? Equatorial Guinea has a GDP per capita of $7,000+ yet 77% of its people live in poverty. The United States has the world's largest economy but ranks only 15th in happiness. Bhutan has a tiny GDP but leads the world in Gross National Happiness. This article examines GDP's definition and formulas, its 10 fundamental limitations with global examples, paradoxes from countries like Qatar, Japan, Norway vs Nigeria, alternative metrics (HDI, GNH, Gini, GPI), the Beyond GDP movement, and why we need to look beyond the numbers to understand true development.
Key Takeaways
- GDP measures total market value of all final goods and services produced within a country's borders -- but was designed only to track production, not human wellbeing.
- GDP's formula is C + I + G + (X - M): Consumption, Investment, Government Spending, and Net Exports. Nominal GDP is not adjusted for inflation; Real GDP is.
- GDP ignores income inequality: the USA has $25.5T GDP but the top 10% own 70% of wealth. South Africa is 'upper middle income' by GDP but has the world's highest Gini coefficient (0.63).
- Environmental destruction INCREASES GDP: the BP Deepwater Horizon cleanup cost $65 billion -- all counted as economic growth. The ecological damage was not subtracted.
- Approximately 2 billion people work in the informal economy (ILO) and approximately $10.8 trillion in unpaid care work (McKinsey) are largely invisible to GDP measurement.
- GDP paradoxes: Equatorial Guinea has the highest GDP per capita in Africa yet 77% live in poverty. Japan's GDP has been flat for 30 years yet it has the world's highest life expectancy and lowest crime rate.
- Alternatives to GDP include HDI (health + education + income), Gini Coefficient (inequality), GNH (Gross National Happiness, Bhutan), GPI (GDP adjusted for social and environmental costs), and MPI (multidimensional poverty).
- The Easterlin Paradox: beyond approximately $75,000 GDP per capita, additional economic growth does not produce meaningful increases in reported happiness.
- The Beyond GDP movement is gaining ground: New Zealand's Wellbeing Budget (2019), Scotland's 81-indicator National Performance Framework, the WEGo Alliance (Iceland, Finland, Canada, New Zealand, Scotland, Wales), and the Stiglitz-Sen-Fitoussi Commission all advocate a dashboard approach.
- GDP is a useful tool for tracking recessions, comparing output, and planning fiscal policy -- but a dangerous master when used as the sole measure of civilizational progress.
Introduction -- GDP Is Growing, But Is the World Really Getting Better?
"GDP measures everything except that which makes life worthwhile." -- Robert F. Kennedy, University of Kansas, March 18, 1968
Robert F. Kennedy stood at a podium at the University of Kansas and delivered one of the most prophetic speeches in modern history. He dismantled the idea that a nation's worth could be measured in dollars and production figures. Three months later, he was assassinated. But his words have only grown more powerful with time.
That was 1968. More than five decades later, the world has added more zeros to the GDP scoreboard than Kennedy could have imagined -- and yet his warning has never felt more urgent.
Global GDP is projected to surpass $115 trillion in 2025 (IMF) -- an all-time record. A number so large it is almost impossible to comprehend. And yet, at the very same moment this record was being celebrated:
Oxfam reported that the top 1% of humanity owns 46% of all global wealth. The climate crisis is intensifying at a pace that threatens entire ecosystems. Mental health disorders have reached epidemic proportions in virtually every country. And approximately 700 million people -- nearly 1 in 10 human beings alive today -- still live in extreme poverty on less than $2.15 a day, according to the World Bank.
How is it possible that the world has never been richer, and yet so many problems remain unsolved? The answer, at least in part, lies in what we choose to measure -- and what we choose to ignore.
GDP's own inventor, Simon Kuznets, warned the U.S. Congress in 1934: "The welfare of a nation can scarcely be inferred from a measurement of national income." The world nodded politely -- and then ignored him for 90 years.
Here is the irony that textbooks rarely mention: GDP was not invented to measure wellbeing, happiness, or human progress. It was invented during the Great Depression specifically to measure one thing -- production and income -- so that governments could plan war economies and track industrial output. It was a wartime accounting tool. We have since elevated it into the universal yardstick of civilizational success.
This article is not an attack on GDP. GDP is a useful tool. The problem is that we have made it the ONLY tool. And when you have only a hammer, everything starts to look like a nail.
But what exactly does GDP measure? And more importantly -- what does it miss?
What GDP Actually Measures -- Definition, Formula, and Methods
Before we can critique GDP, we have to understand it precisely. Most people have heard the term thousands of times but could not explain what it actually calculates. Let us fix that.
The Definition
GDP (Gross Domestic Product) is the total market value of all final goods and services produced within a country's borders during a specific time period -- usually one year or one quarter.
Three words in that definition do heavy lifting. "Final" means we only count the end product, not every intermediate step (so we count the car, not the steel, rubber, and glass separately -- to avoid double counting). "Within a country's borders" means it doesn't matter who owns the factory -- if it's producing inside the country, it counts. "Market value" means only things with a price tag count.
The Formula: GDP = C + I + G + (X - M)
C = Consumption -- all spending by households (food, clothing, cars, Netflix subscriptions). Typically 55-70% of GDP in most countries.
I = Investment -- business spending on machinery, buildings, and inventory. Also includes residential construction.
G = Government Spending -- public services, infrastructure, defence, salaries. Does NOT include transfer payments like pensions or welfare.
(X - M) = Net Exports -- Exports minus Imports. If a country exports more than it imports, this adds to GDP. If it imports more, it subtracts.
Three Methods of Measurement
Economists can calculate GDP three different ways, and in theory, all three should give the same answer -- though in practice, they produce slightly different figures due to data gaps.
Expenditure Approach (most common): Adds up everything spent on final goods and services. This is the C+I+G+(X-M) formula.
Income Approach: Adds up all income earned in the economy -- wages, profits, rents, and interest. Total income = Total output.
Production/Output Approach: Adds up the value added at each stage of production across all industries.
Nominal vs Real GDP
Nominal GDP is calculated at current prices, without adjusting for inflation. This can be misleading -- if prices simply rose by 5% and output didn't change, nominal GDP still went up 5%.
Real GDP adjusts for inflation using a base year's prices, giving a true picture of whether actual output increased. This is the number that matters for genuine economic comparisons over time.
Example: If a country's GDP grew 5% in nominal terms but inflation was 4%, real GDP growth is only about 1%. Politicians sometimes tout the nominal figure. Economists care about the real one.
GDP per Capita -- The Average That Hides Everything
GDP per capita = Total GDP divided by total population. It is meant to give a rough sense of the average standard of living.
But averages are dangerously deceptive. Imagine a room with two people. One earns $1 million a year. The other earns $0. The average income in that room is $500,000. But one person is destitute. GDP per capita works exactly like this -- it tells you the average but hides who is actually capturing the gains.
This is not a hypothetical problem. It is the lived reality of billions of people in countries with impressive GDP numbers and devastating poverty rates. The table below illustrates the scale.
| Rank | Country | GDP Nominal (2023) | GDP per Capita | Population | Key Fact |
| 1 | United States | $29 trillion (2025 estimate) | $76,400 | 335 million | Richest by total GDP; 28M+ uninsured citizens |
| 2 | China | $19.5 trillion (2025 estimate) | $13,800 | 1.4 billion | 2nd largest but only 73rd by per capita |
| 3 | Germany | $4.6 trillion | $55,000 | 84 million | Europe's largest economy; aging population challenge |
| 4 | Japan | $4.4 trillion | $35,000 | 125 million | Flat GDP for 30 years; top quality of life globally |
| 5 | India | $4.3 trillion (2025 estimate) | $2,900 | 1.43 billion | 5th overall but 136th per capita; 800M on food aid |
| 6 | United Kingdom | $3.4 trillion | $46,200 | 67 million | Post-Brexit economic uncertainty |
| 7 | France | $3.2 trillion | $46,500 | 68 million | Strong social safety net despite moderate growth |
| 8 | Italy | $2.2 trillion | $37,300 | 59 million | High debt-to-GDP; youth unemployment crisis |
| 9 | Brazil | $2.1 trillion | $9,600 | 215 million | Massive inequality; Gini 0.53 |
| 10 | Canada | $2.1 trillion | $54,900 | 38 million | High per capita but rising cost-of-living crisis |
Note: GDP figures are approximate 2025 estimates from IMF/World Bank data. Rankings shift with exchange rates. Per capita figures use nominal USD.
These numbers look impressive. But what are they hiding?
The 10 Fundamental Flaws of GDP -- What It Doesn't Measure
Every tool has limits. A thermometer measures temperature but not blood pressure. GDP measures market output -- but it was never designed to measure human wellbeing, environmental health, or social equity. The trouble starts when we forget that distinction.
Here are ten of GDP's most consequential blind spots, each one illustrated with real-world examples that have affected real human lives.
1. GDP Ignores Inequality
GDP is a sum, not a distribution. It tells you the total size of the pie -- not how it is sliced. And across the world, the slicing has become grotesquely unequal.
In the United States, GDP stands at approximately $29 trillion (2025 estimate). But according to the Federal Reserve, the top 10% of Americans own 70% of all wealth. The bottom 50% -- roughly 167 million people -- own just 2.5% of the wealth. GDP is at record highs. Poverty has not disappeared.
In South Africa, the country is classified as "upper middle income" by GDP metrics. But its Gini coefficient -- the standard measure of inequality -- stands at 0.63, making it the world's most unequal nation. Apartheid ended decades ago; the wealth gap has barely changed.
In Qatar, GDP per capita exceeds $87,000 -- among the highest on Earth. But 88% of the population are migrant workers, many with restricted freedoms and wages that bear no resemblance to that $87,000 average.
"If Bill Gates walks into a bar with 50 people, the average net worth in the room instantly becomes $2 billion. But not a single one of the 49 other people has gotten richer."
GDP performs the same trick on a national scale, every single year.
2. GDP Misses the Informal Economy
Approximately 2 billion people worldwide -- according to the International Labour Organization -- work in the informal economy. Street vendors, subsistence farmers, domestic workers, small craftspeople. They produce real value. They feed families. They sustain communities. GDP largely ignores them.
In India, economists estimate that over 50% of actual economic activity happens in the informal sector, yet it is poorly captured in official GDP statistics. India's official GDP is therefore a significant undercount of real economic life.
In Sub-Saharan Africa, the informal economy represents 40-60% of actual economic activity in many countries. When GDP is used to compare African development against Western benchmarks, it compares apples to oranges.
The woman selling vegetables in Lagos, the mechanic fixing motorcycles in Nairobi, the seamstress in Dhaka working from her home -- they are the economy. GDP just cannot see them.
3. GDP Ignores Unpaid Care and Household Work
Every day, across every country on Earth, billions of hours of work are performed that never appear in GDP statistics. Cooking meals. Raising children. Caring for elderly parents. Volunteering in communities. This work has enormous economic value -- but since no money changes hands, GDP registers it as zero.
McKinsey Global Institute estimates that global unpaid care work is worth approximately $10.8 trillion per year. If it were a country, it would be the world's third largest economy -- bigger than Germany and Japan combined.
Here is the perverse logic this creates: A mother who stays home to raise her children contributes $0 to GDP. If she pays a nanny to do the same work, GDP goes up. The care provided to the child is identical in both cases. GDP only counts the version where money changes hands.
The OECD finds that women perform more than twice as much unpaid work as men across all countries studied. GDP's blindness to this work is not just an economic distortion -- it is a systematic undervaluation of work traditionally done by women.
4. Environmental Destruction INCREASES GDP
This is perhaps GDP's most dangerous flaw -- and the one with the most catastrophic long-term consequences. GDP does not distinguish between activities that build wealth and activities that destroy it. Burning down a forest and building a shopping mall on the ashes both increase GDP.
The BP Deepwater Horizon disaster (2010) released 4.9 million barrels of oil into the Gulf of Mexico. The cleanup cost $65 billion. Every dollar of that cleanup -- the wages, the equipment, the legal fees, the PR campaigns -- counted as GDP growth. The ecological destruction? Not counted at all.
The Exxon Valdez spill (1989) was similar: cleanup crews, medical costs, the construction of a new tanker -- all GDP positive. From a GDP perspective, environmental disasters are actually good for the economy.
In China, decades of extraordinary GDP growth lifted hundreds of millions out of poverty -- a genuine achievement. But the WHO estimates that air pollution now causes more than 1 million premature deaths per year in China. The lung cancer treatments and funeral costs? They also increase GDP.
"Imagine your house catches fire. The firefighters' wages, the hospital bills, the cost of rebuilding -- all are GDP positive. But are you better off than before the fire?"
5. War and Disasters Can BOOST GDP
The connection between destruction and GDP growth is not limited to the environment. War -- the deliberate destruction of human life and civilization -- can actually boost a country's GDP figures.
During World War II, U.S. GDP grew by approximately 75%. Were American lives 75% better? Hundreds of thousands of Americans died. Millions more returned with physical and psychological wounds. But the factories were running, the spending was flowing, and GDP was celebrating.
After the 2011 Japan tsunami, which killed nearly 20,000 people and displaced hundreds of thousands more, the massive reconstruction spending actually provided a short-term boost to Japan's GDP. GDP went up. 20,000 people were still dead.
The economist Frederic Bastiat identified this logical flaw all the way back in 1850 in his essay 'The Broken Window.' If a boy breaks a baker's window, the glazier gets work, the glazier spends his wages, economic activity is created. But the baker is worse off -- he has a window that was whole before. Destruction does not create wealth; it merely redistributes spending while erasing value. GDP misses this distinction entirely.
6. GDP Doesn't Measure Quality of Life
Perhaps the most intuitive flaw: two countries can have vastly different GDPs and yet citizens of the smaller economy can live better, longer, happier lives.
The United States has an economy five times larger than Denmark's. Yet Denmark consistently ranks in the top 2-3 of the World Happiness Report. Americans work more hours, have higher rates of anxiety and depression, and face greater economic insecurity than Danes.
Japan's GDP is one of the world's largest. But the Japanese language has a word -- karoshi -- that means "death from overwork." It is common enough to have its own word, its own legal category, and its own government statistics. Suicide rates in Japan are among the highest in the developed world.
Costa Rica has a GDP per capita of only around $13,000. But it ranks #1 on the Happy Planet Index. It has free universal healthcare. It generates 99% of its electricity from renewable sources. Its citizens live longer than Americans.
Finland has been ranked the world's happiest country for six consecutive years. Its secret? Not the highest GDP -- but the highest levels of social trust, an excellent public education system, strong safety nets, and a culture that values leisure and family time alongside work.
7. GDP Doesn't Measure Health or Education Quality
GDP counts spending. It does not count outcomes. This distinction has life-or-death consequences.
The United States spends 18% of its GDP on healthcare -- approximately $4.3 trillion per year, more than any other nation on Earth. Yet the average American lives to 78 years. Cuba, which spends roughly 90% less per capita on healthcare, has an average life expectancy of 79 years.
More money in the GDP column does not mean better health. It means more spending -- which could reflect high drug prices, administrative waste, and profit-driven medicine as much as it reflects actual care.
Sierra Leone has increased education spending significantly over recent years, boosting GDP indicators. Yet adult literacy remains at approximately 43%. GDP records the spending on teachers and schools. It does not record whether children actually learn.
8. GDP Doesn't Distinguish Debt-Fueled Growth
A country can borrow aggressively, spend massively, and post impressive GDP numbers -- all while digging a deeper and deeper financial hole. GDP does not distinguish between growth that is earned and growth that is borrowed.
Japan's debt-to-GDP ratio has reached 264% -- the highest of any developed nation on Earth. GDP figures look relatively stable. But the underlying debt mountain is staggering. Future generations of Japanese workers will spend their entire careers servicing it.
Greece is the cautionary tale. Its GDP was growing through the 2000s. Then the debt bubble burst in 2010, triggering a crisis that shrank the economy by 25%, caused unemployment to exceed 27%, and immiserated an entire generation. GDP recorded the good years. It did not predict the catastrophe.
The United States crossed $36 trillion in national debt in 2024 -- more than 120% of GDP. GDP keeps growing. The debt keeps growing faster. Whether this is sustainable is one of the most consequential questions in global economics. GDP alone cannot answer it.
9. GDP Ignores Natural Resource Depletion
When a country digs oil out of the ground and sells it, GDP goes up. When the oil runs out, GDP eventually crashes. But during all those years of extraction, GDP was recording growth -- while the real underlying wealth (the oil reserve) was being permanently depleted.
Saudi Arabia has built its entire economy on oil exports. GDP has been high for decades. But the kingdom itself acknowledges -- through its Vision 2030 plan -- that the oil wealth cannot last forever. GDP never counted the drawdown of the reserve.
The Amazon rainforest produces approximately 20% of the world's oxygen and hosts 10% of all species on Earth. When it is logged, GDP goes up -- timber sales, cleared land for agriculture, construction. When the ecosystem collapses and rainfall patterns shift, the GDP of the entire continent will eventually be affected. But that cost is not on today's balance sheet.
The World Bank's own 'Changing Wealth of Nations' study found that many countries showing robust GDP growth are actually getting poorer in real terms when natural capital depletion is properly accounted for. GDP shows them as thriving. Their true wealth is declining.
10. GDP Can't Capture the Digital Economy
The modern economy increasingly runs on things that are free, shared, and non-rival -- meaning one person using them does not prevent another from doing so. GDP, built in a world of physical goods and market transactions, struggles enormously to capture this value.
Wikipedia provides the equivalent of approximately $3.6 billion worth of information value to users every year -- according to researchers at MIT. GDP records $0, because Wikipedia is free.
Google Search, open-source software, free educational videos, public libraries online -- billions of people derive enormous benefit from these services daily. Their collective wellbeing is genuinely improved. GDP barely notices.
MIT research estimated that the consumer surplus from the internet alone is worth an estimated $30,000 per person per year in quality-of-life improvements -- value that GDP scarcely captures.
Here is the absurdity this creates: If every person who uses Wikipedia were to switch to a paid encyclopedia, GDP would INCREASE. But no one would be better off. In fact, the people who could not afford the paid version would be worse off. GDP would celebrate the transaction. Human welfare would not.
These are not theoretical criticisms. Real countries, real people are being misled by GDP right now. Let us look at the most striking examples of where GDP and reality have completely diverged.
The World's Greatest GDP Paradoxes -- When Numbers Lie
Theory is one thing. But nothing illustrates GDP's failures more vividly than real countries where the numbers and the lived reality point in completely opposite directions. These are not edge cases. They are among the world's most consequential economies.
The Equatorial Guinea Paradox
Equatorial Guinea's GDP per capita exceeds $7,000 -- the highest in sub-Saharan Africa. On paper, it is wealthier than many developing nations.
In reality, approximately 77% of its population lives below the poverty line. Life expectancy is only 60 years. Access to clean water is limited. Healthcare is underfunded. Education outcomes are poor.
The explanation is straightforward and brutal: oil wealth flows almost entirely to the ruling Obiang family, who have controlled the country since 1979. The president's son, Teodorin Obiang, owns a $30 million mansion in Malibu, a private yacht, and a private jet -- while citizens lack basic services. GDP records the oil revenue. It does not record who pockets it.
India vs Bhutan -- GDP Giant vs Happiness Leader
India is the world's fifth largest economy -- $4.3 trillion (2025 estimate) in GDP. A genuinely extraordinary achievement by any historical standard. And yet, more than 800 million Indians depend on free government food rations distributed under the National Food Security Act to survive. The GDP numbers and the food security numbers coexist without contradiction because GDP measures total output, not whether people can eat.
Bhutan's total GDP is barely $2.7 billion -- smaller than many medium-sized cities. But Bhutan offers free healthcare, free education, and has constitutionally mandated forest coverage of at least 60% of its land. More famously, it introduced the concept of Gross National Happiness in 1972.
"Gross National Happiness is more important than Gross Domestic Product." -- King Jigme Singye Wangchuck of Bhutan, 1972
Who is more developed? The answer depends entirely on what you choose to measure.
America -- The World's Largest GDP But Not the Happiest
The United States has a GDP of approximately $29 trillion (2025 estimate) -- more than the next three countries combined. It is, by one very specific measure, the most successful economy in human history.
And yet: The United States ranks 15th in the World Happiness Report (Finland is 1st, with a fraction of U.S. GDP). Approximately 27 million Americans had no health insurance in 2023. Medical bankruptcy is the single largest cause of personal bankruptcy -- a phenomenon that essentially does not exist in other wealthy nations. Student loan debt has reached $1.8 trillion, affecting 44 million borrowers.
American life expectancy has been declining since 2019 -- a trend unique among developed nations and driven by the opioid crisis, gun violence, and inadequate healthcare access. GDP is at record highs. Longevity is going in the wrong direction.
None of this appears in the GDP figures. All of it appears in the lives of ordinary Americans.
Norway vs Nigeria -- Two Oil Stories, Two Outcomes
Both Norway and Nigeria built their modern economies on oil. Both discovered large reserves in roughly the same era. The outcomes could not be more different.
Norway took its oil revenues and built the world's largest sovereign wealth fund -- now valued at approximately $1.6 trillion. It invested in education, healthcare, and infrastructure. It established transparent governance and low corruption. Norway consistently ranks #1 or #2 on the UNDP Human Development Index.
Nigeria is Africa's largest oil producer. Yet 40% of its citizens live below the poverty line. Corruption has been endemic for decades. Estimates suggest that more than $400 billion in oil revenue has been misappropriated or stolen since independence. Basic infrastructure remains underdeveloped.
Same resource. Same starting point. Completely different outcomes. GDP measured the oil extraction in both countries. It could not measure governance, institutional quality, or whether the wealth would reach the people. The difference was not in the oil -- it was in the institutions.
Japan's 'Lost Decades' -- Was Japan Really Losing?
Since the asset bubble burst in the early 1990s, Japan's GDP growth has been essentially flat. Western economists labeled the period 'The Lost Decades' and treated it as a cautionary tale of economic failure.
But let us look at what Japan maintained during those 'lost' decades: The world's lowest violent crime rate. The highest life expectancy of any large nation (84 years). Some of the world's finest public infrastructure. Near-zero homelessness. Low income inequality. A manufacturing sector famous for precision and quality.
Japan's GDP stopped growing. Japanese quality of life did not decline. What does that tell us about what GDP is actually measuring?
Qatar -- Behind the World's Highest GDP per Capita
Qatar's GDP per capita exceeds $87,000 -- routinely placing it at or near the top of global rankings. Numbers like this suggest a prosperous, thriving population.
But 88% of Qatar's population are migrant workers, predominantly from South and Southeast Asia. In 2022, a Guardian investigation estimated that more than 6,500 migrant workers had died during the construction projects related to the FIFA World Cup. Their wages and their deaths are captured very differently in the statistics.
GDP per capita in Qatar is the average of both the wealthy Qatari citizens and the low-wage migrant workers. But it is presented as a single, unified prosperity figure. It is not.
| Country | GDP per Capita | HDI Rank | Happiness Rank | Key Paradox |
| Equatorial Guinea | $7,000+ | 145th | N/A | 77% in poverty despite highest African GDP per capita |
| United States | $76,400 | 21st | 15th | World's richest; 27M uninsured, declining life expectancy |
| India | $2,900 | 132nd | 126th | 5th largest GDP; 800M+ depend on government food aid |
| Bhutan | $3,300 | 127th | N/A | Free healthcare, GNH model; thriving without high GDP |
| Qatar | $87,000+ | 42nd | 30th | 88% migrant workers; top GDP masks inequality |
| Norway | $106,000 | 1st | 7th | Oil wealth turned into $1.6T sovereign fund; HDI leader |
| Nigeria | $2,200 | 163rd | 98th | Africa's top oil producer; 40% below poverty line |
| Japan | $35,000 | 19th | 47th | 'Lost decades' of GDP growth yet high quality of life |
| Costa Rica | $13,000 | 62nd | 12th | No army; 99% renewables; life expectancy beats the USA |
| South Africa | $6,400 | 109th | 91st | Upper middle income GDP; world's most unequal country |
Note: HDI and Happiness Rankings are approximate 2024-2025 data from UNDP Human Development Report and World Happiness Report. Rankings change annually.
The evidence is clear: GDP rank and human wellbeing rank are two very different things. So what better tools exist? Let us explore the alternatives.
Better Ways to Measure Development -- The Alternatives
The critique of GDP is not new. For decades, economists, philosophers, policymakers, and development experts have been building alternative frameworks that capture what GDP misses. None of them are perfect -- but each one sees part of the picture that GDP is blind to.
HDI -- Human Development Index (UNDP, since 1990)
The Human Development Index was created by the United Nations Development Programme in 1990, primarily by Pakistani economist Mahbub ul Haq and Indian Nobel laureate Amartya Sen. It was a direct response to GDP's limitations.
HDI combines three components: Life Expectancy (how long people live), Education (mean and expected years of schooling), and Income (Gross National Income per capita, adjusted for purchasing power).
The results are revealing. Norway consistently ranks #1 on HDI. The United States, which tops GDP rankings, drops to 21st on HDI. Cuba, with roughly one-twentieth the GDP per capita of the USA, achieves an HDI of 0.764 compared to America's 0.921 -- remarkably close on health and education outcomes despite a massive income gap.
GNH -- Gross National Happiness (Bhutan, 1972)
Bhutan's GNH framework is measured across nine domains: psychological wellbeing, health, education, time use, cultural resilience and diversity, good governance, community vitality, ecological diversity and resilience, and living standards.
What makes GNH remarkable is its philosophical foundation: the goal of development is not maximum production but maximum wellbeing. Bhutan does not always score highest on happiness surveys. But it has kept its forests, maintained its culture, provided free public services, and built a model that other nations are now studying seriously.
In 2019, New Zealand became the first major economy to adopt a formal 'Wellbeing Budget,' allocating government spending based on mental health outcomes, child welfare, domestic violence prevention, and environmental sustainability -- inspired in part by the GNH model.
Gini Coefficient -- Measuring Inequality
The Gini coefficient measures income or wealth inequality on a scale from 0 (perfect equality -- everyone has the same) to 1 (perfect inequality -- one person has everything).
South Africa: 0.63 -- the world's most unequal nation. Despite a middle-income GDP, the legacy of apartheid persists in wealth distribution.
Denmark: 0.28 -- one of the world's most equal, despite high GDP. Equality and prosperity coexist.
United States: 0.39 -- the highest Gini coefficient among all developed nations. Wealth has been concentrating at the top for four decades.
GPI -- Genuine Progress Indicator
The Genuine Progress Indicator takes GDP as its starting point and then adjusts it: adding the estimated value of unpaid household and volunteer work, and subtracting the costs of crime, pollution, inequality, loss of leisure time, and natural resource depletion.
The results for the United States are stark: While U.S. GDP has roughly tripled since the 1970s, GPI has been essentially flat. The gains in production have been offset, in GPI terms, by rising inequality, environmental degradation, and increased crime and social costs.
This does not mean Americans are no better off than in 1970. It means that the progress made in production has largely been consumed by the costs that GDP never counted.
MPI -- Multidimensional Poverty Index
The Multidimensional Poverty Index, developed by the Oxford Poverty and Human Development Initiative and UNDP, measures poverty beyond just income. It assesses ten indicators across three dimensions: health (nutrition, child mortality), education (years of schooling, school attendance), and living standards (cooking fuel, sanitation, water, electricity, housing, assets).
The finding: approximately 1.1 billion people are classified as multidimensionally poor -- many of them in countries that would be considered lower-middle income by GDP standards. The income measure alone misses this complexity entirely.
OECD Better Life Index
The OECD Better Life Index, launched in 2011, evaluates 11 dimensions of wellbeing: housing, income, jobs, community, education, environment, civic engagement, health, life satisfaction, safety, and work-life balance.
It is interactive -- users can assign different weights to different dimensions based on their own values. It acknowledges what GDP never does: that people value different things, and that no single number can capture what makes a life good.
| Metric | Created By / Year | Measures | Top Country | USA Rank | Key Strength | Key Weakness |
| GDP | Simon Kuznets / 1934 | Market output | USA | 1st | Simple, comparable, real-time | Ignores welfare, inequality, ecology |
| HDI | UNDP / 1990 | Life, education, income | Norway | 21st | Captures human outcomes | Only 3 dimensions; misses happiness |
| GNH | Bhutan / 1972 | 9 wellbeing domains | Bhutan | N/A | Holistic; culture-inclusive | Hard to standardize globally |
| Gini Coefficient | Corrado Gini / 1912 | Income/wealth inequality | Slovenia/Denmark | High (0.39) | Simple inequality measure | Single dimension only |
| GPI | Cobb et al. / 1995 | GDP adjusted for social/env costs | Varies | Lower than GDP | Corrects major distortions | Data-intensive; methodological debate |
| MPI | OPHI-UNDP / 2010 | 10 poverty indicators | Low-poverty nations | Moderate | Captures depth of poverty | Threshold choices are subjective |
| OECD Better Life | OECD / 2011 | 11 wellbeing dimensions | Varies by weights | Varies | Multidimensional; user-adjustable | OECD members only; self-reported |
Note: Rankings and assessments are approximate and vary by year and methodology. Each index has its own data sources and definitions.
Each of these alternatives captures something real that GDP misses. But do the numbers actually show a meaningful gap between GDP performance and human progress? The data is striking.
The Data Doesn't Lie -- GDP vs Reality in Numbers
The most powerful argument against treating GDP as the only measure of progress is not theoretical -- it is empirical. When you place GDP rankings side by side with HDI, happiness, and inequality data, the divergences are impossible to ignore.
| Country | GDP Rank | GDP per Capita | HDI Rank | Happiness Rank | Gini | Key Insight |
| USA | 1st | $76,400 | 21st | 15th | 0.39 | Richest but not happiest; high inequality |
| China | 2nd | $13,800 | 79th | 60th | 0.38 | Fast growth; inequality and freedom gaps |
| Norway | 10th (total) | $106,000 | 1st | 7th | 0.26 | Moderate GDP; top HDI and equality |
| Finland | ~50th (total) | $54,000 | 12th | 1st | 0.27 | Consistent happiness leader despite modest GDP |
| Denmark | ~35th (total) | $67,000 | 9th | 2nd | 0.28 | High equality, high happiness, strong social trust |
| India | 5th | $2,900 | 132nd | 126th | 0.35 | Huge total GDP; massive per capita poverty |
| Bhutan | ~150th (total) | $3,300 | 127th | N/A | 0.37 | Low GDP; GNH pioneer; ecological wealth |
| Japan | 4th | $35,000 | 19th | 47th | 0.33 | High GDP; moderate happiness despite quality of life |
| Qatar | ~50th (total) | $87,000+ | 42nd | 30th | High | Highest per capita; migrant worker inequality |
| Nigeria | ~25th (total) | $2,200 | 163rd | 98th | 0.43 | Major oil economy; most citizens in poverty |
| South Africa | ~38th (total) | $6,400 | 109th | 91st | 0.63 | Upper middle income GDP; world's most unequal |
| Cuba | ~80th (total) | $9,500 | 83rd | N/A | 0.38 | Low GDP; health/education rivals wealthy nations |
| Brazil | 9th | $9,600 | 87th | 44th | 0.53 | Top 10 economy; extreme inequality persists |
| New Zealand | ~50th (total) | $48,000 | 13th | 10th | 0.33 | Wellbeing Budget pioneer; high happiness |
| Costa Rica | ~80th (total) | $13,000 | 62nd | 12th | 0.48 | No army; 99% renewables; beats USA in happiness |
Note: Data is approximate, compiled from IMF, World Bank, UNDP HDR 2024-2025, and World Happiness Report 2025. Rankings vary by year.
The pattern is unmistakable. Nations with the highest GDP are not consistently the most developed by any other measure. Nations with relatively modest GDP can achieve extraordinary human outcomes when resources are distributed equitably and invested in people.
| Country | GDP Growth (10yr avg) | Life Expectancy Change | Inequality Trend | CO2 Emissions Change | Happiness Trend |
| USA | +2.1%/yr | -0.3 yrs (declining) | Worsening | +3% total | Declining (fell from 11th to 15th) |
| China | +6.8%/yr | +2.5 yrs | Improving slightly | +40% total | Flat |
| Germany | +1.4%/yr | +1.2 yrs | Stable | -25% (green transition) | Stable |
| India | +6.5%/yr | +3.1 yrs | Worsening | +80% total | Declining |
| Norway | +1.8%/yr | +1.5 yrs | Stable (low) | -15% | Top 10 consistently |
| Nigeria | +2.5%/yr | +2.0 yrs | Worsening | +20% | Low and declining |
| New Zealand | +2.2%/yr | +1.3 yrs | Improving (Wellbeing Budget) | -10% | Top 10 consistently |
| Brazil | +0.8%/yr | +2.0 yrs | Improving slowly | +15% | Moderate, stable |
Note: Approximate trend data from World Bank, UNDP, and IEA. Decade averages cover approximately 2015-2025.
The Easterlin Paradox -- named after economist Richard Easterlin -- offers another data point: once a country's per capita income reaches approximately $75,000 per year, additional GDP growth does not produce meaningful increases in reported happiness. Beyond that threshold, what matters is how income is distributed, how secure people feel, and how much they trust their institutions.
The data, taken together, makes a compelling case: GDP growth is necessary but not sufficient. It is a floor, not a ceiling. Once basic needs are met, the quality of growth matters far more than the quantity.
But before we dismiss GDP entirely, let us be fair about what it does well.
In GDP's Defense -- Why It Still Matters
Intellectual honesty demands that we acknowledge GDP's genuine strengths. It is easy to critique. It is harder, and more useful, to understand what it actually does well -- and therefore when to use it.
GDP is standardized. It is calculated using broadly consistent methodologies in more than 190 countries. This makes cross-country comparisons possible in a way that no other metric yet achieves at global scale.
GDP has history. More than 80 years of consistent data makes long-run trend analysis possible. You can trace the economic history of the 20th century through GDP data in ways that no alternative metric yet allows.
GDP is real-time. Quarterly GDP data tracks recessions and recoveries faster than most alternative indicators. For central banks and finance ministries that need to make policy decisions in near-real-time, this matters enormously.
GDP enables fiscal policy. Government budgets, tax policy, debt-to-GDP ratios, bond markets, and international lending decisions all rely on GDP data. The IMF, World Bank, and sovereign credit rating agencies could not function without it.
GDP does correlate with positive outcomes -- up to a point. Higher GDP tends to be associated with lower infant mortality, higher literacy, better infrastructure, greater life expectancy, and more political freedom. The correlation is imperfect and diminishes at higher income levels, but it is real. Economic growth has genuinely lifted billions out of poverty.
The problem is not GDP itself. The problem is using GDP ALONE as the measure of all things. Simon Kuznets -- the very man who invented the measure -- explicitly warned Congress in 1934 not to use it as a welfare measure. Policymakers chose to ignore that warning.
"GDP is like a speedometer. It tells you how fast you're going. It does not tell you if you're going in the right direction -- or whether the road ends in a cliff."
Used as one indicator among many, GDP is valuable and important. Used as the singular definition of success, it actively misleads. The world has, for decades, been confusing speed for direction.
The good news: a global movement has been building -- for decades -- to fix exactly this. Let us look at who is leading it.
The Beyond GDP Movement -- Is the World Changing Course?
The critique of GDP has moved from academic papers to presidential commissions to national budgets. The 'Beyond GDP' movement is no longer fringe economics. It is mainstream policy in a growing number of countries -- and the momentum is building.
The Stiglitz-Sen-Fitoussi Commission (2008-2009)
In 2008, French President Nicolas Sarkozy commissioned a group of the world's leading economists to answer a simple but profound question: are our economic indicators measuring the right things?
The commission was led by Nobel laureate Joseph Stiglitz (Columbia University), philosopher and economist Amartya Sen (Harvard), and Jean-Paul Fitoussi (Sciences Po Paris). Their report, published in 2009, was unequivocal.
"GDP is a poor measure of wellbeing. We need a dashboard of indicators." -- Stiglitz-Sen-Fitoussi Commission, 2009
The report catalyzed policy conversations across Europe, the OECD, and the United Nations that continue to this day. It gave intellectual permission to policymakers who had privately doubted GDP's supremacy but lacked the authority to say so publicly.
New Zealand's Wellbeing Budget (2019)
In May 2019, New Zealand made history. Prime Minister Jacinda Ardern's government presented the world's first national budget explicitly designed around wellbeing priorities rather than GDP growth alone.
The budget allocated funds based on progress in mental health outcomes, child poverty reduction, domestic violence prevention, indigenous Maori wellbeing, and environmental sustainability. For each spending decision, the question was not just 'does this grow GDP?' but 'does this improve lives?'
"We are not just chasing economic growth for its own sake. We are focused on making our country a better place." -- Prime Minister Jacinda Ardern, 2019
Scotland's National Performance Framework
Scotland has gone further than almost any other country in embedding alternative metrics into governance. Its National Performance Framework uses 81 indicators to track national progress. GDP is just one of them. Others include: child poverty rates, carbon emissions, mental wellbeing scores, public trust in government, access to green spaces, and social isolation levels.
The philosophy: a government should be accountable for all of these things, not just economic output.
The WEGo Alliance -- Wellbeing Economy Governments
Iceland, New Zealand, Scotland, Wales, Finland, and Canada have formed the Wellbeing Economy Governments (WEGo) alliance -- a formal network of national and sub-national governments committed to placing wellbeing at the center of economic policy alongside GDP.
These are not small, fringe nations. They include some of the world's most advanced economies. Their collaboration is producing a body of evidence and practice that is influencing the broader international policy conversation.
World Bank -- Changing Wealth of Nations
Even the World Bank -- historically one of GDP's strongest institutional champions -- has been developing alternative frameworks. Its 'Changing Wealth of Nations' report measures comprehensive national wealth as the sum of three capitals: natural capital (forests, fisheries, minerals), human capital (the productive capacity of the population), and produced capital (machinery, infrastructure, buildings).
The finding is uncomfortable for GDP advocates: numerous countries that show strong GDP growth are actually depleting their comprehensive wealth -- running down their natural capital faster than they are accumulating produced capital. GDP records them as thriving. Their true wealth is declining.
EU Beyond GDP Initiative
Since at least 2007, the European Commission has been developing supplementary indicators for environmental sustainability, social inclusion, and governance quality. The EU's statistical agency Eurostat now publishes a comprehensive set of 'quality of life' indicators alongside GDP data.
The direction of travel is clear. GDP is not being replaced -- but it is being contextualized, supplemented, and challenged as never before.
| Country / Initiative | Year | Focus Areas | Current Status |
| Bhutan GNH | 1972 | 9 wellbeing domains including ecology, culture, governance | Constitutional; active GNH Commission |
| France Commission (Stiglitz) | 2008 | Wellbeing, sustainability, quality of life | Published landmark 2009 report; influenced EU policy |
| OECD Better Life Index | 2011 | 11 wellbeing dimensions across 40+ countries | Active; updated annually; interactive online |
| New Zealand Wellbeing Budget | 2019 | Mental health, child poverty, domestic violence, environment | Active; 2nd and 3rd wellbeing budgets published |
| Scotland NPF | 2007 (revised 2018) | 81 indicators across economy, society, environment | Active; integrated into government planning |
| WEGo Alliance | 2018 | Cross-government wellbeing economy framework | Active; 6 members; growing |
| World Bank Changing Wealth | 2011 (ongoing) | Natural + human + produced capital | Active research; influencing development lending |
| UN SDGs | 2015 | 17 goals, 169 targets across all development dimensions | Active; 2030 deadline framework; 193 countries |
Note: Year refers to initiative launch or key report date. Status reflects publicly available information as of 2025-2026.
The movement is real. The momentum is building. But in the meantime, how should we use GDP wisely today? Let us get practical.
The Do's and Don'ts -- How to Use GDP Properly
The challenge is not to abandon GDP but to use it wisely. Here is a practical framework for economists, policymakers, journalists, students, and informed citizens.
The Do's
Do use GDP to track recessions and recoveries. When an economy contracts for two consecutive quarters, GDP is the fastest available signal. Central banks and governments need this for timely policy responses.
Do compare GDP growth rates over time within a single country. A country growing at 3% vs 1% is a meaningful signal -- as long as you use real (inflation-adjusted) GDP.
Do use GDP per capita for rough income level comparisons between similar countries. Comparing Denmark and Sweden using GDP per capita is reasonable. Comparing Qatar and Nigeria is not -- the structural differences are too large.
Do pair GDP with inequality data. Always ask: what is the Gini coefficient? GDP plus Gini gives a far more complete picture than GDP alone. Norway and Nigeria might have similar growth rates; their Gini coefficients tell very different stories.
Do use GDP alongside HDI for development assessments. The UNDP's Human Development Index is the minimum supplement. Any serious analysis of a country's development should include both.
Do distinguish nominal from real GDP. When governments or media report GDP growth, always ask: is this nominal or real? The difference can be the entire story, especially in high-inflation environments.
Do consider debt-to-GDP ratio. GDP growth funded entirely by debt is a different animal than growth funded by productivity. A country's debt-to-GDP ratio provides essential context.
Do look at GDP per capita trends, not just total GDP. A country with 3% GDP growth but 2.5% population growth has made minimal progress for the average citizen. Per capita growth is the number that matters for living standards.
The Don'ts
Don't use GDP as a measure of wellbeing or happiness. The evidence is overwhelming that beyond a certain income threshold, GDP growth and happiness diverge. Finland has proved this for six consecutive years.
Don't treat GDP per capita as the average citizen's income. In highly unequal societies, GDP per capita is a statistical fiction for the majority of the population. Always check the distribution.
Don't compare GDP across countries without adjusting for purchasing power parity (PPP). $10,000 in India goes much further than $10,000 in Switzerland. Nominal GDP comparisons between countries with very different price levels are misleading.
Don't celebrate GDP growth that is driven by environmental destruction. Logging a rainforest, mining without remediation, or polluting a river increases GDP. None of it makes the country wealthier in a meaningful long-term sense.
Don't use GDP to compare countries at fundamentally different development stages. Applying the same GDP growth benchmark to Germany (a mature economy) and Ethiopia (an early-stage economy) is comparing incomparable realities.
Don't ignore informal economies when assessing developing countries. In many low and middle-income countries, the formal GDP figure may represent only 50-60% of actual economic activity. Policy based only on official GDP will systematically underserve the informal majority.
Don't let GDP dominate the news cycle without context. When a government announces '5% GDP growth,' responsible journalism asks: who benefited? What were the environmental costs? How did inequality change? GDP headlines without context are misleading.
Don't use GDP rankings to declare winners and losers of human civilization. Bhutan, Costa Rica, and Finland regularly beat much 'richer' nations on virtually every human development metric. The scoreboard is bigger than GDP.
Advantages and Disadvantages of GDP
For students, policymakers, and professionals, a clear summary of what GDP does well and where it falls short is essential. Here is a structured overview.
Advantages
Universal comparability. GDP is calculated using broadly standardized methodology across 190+ countries, enabling cross-country economic comparisons that are impossible with most alternative metrics.
Long historical record. More than 80 years of GDP data enables long-run trend analysis, recession identification, and historical economic research.
Policy responsiveness. Quarterly GDP data enables governments and central banks to respond quickly to economic slowdowns. No other macro indicator is as timely.
Market confidence indicator. GDP growth figures affect investor confidence, sovereign credit ratings, and international borrowing costs. Markets are wired to respond to GDP data.
Recession detection. Two consecutive quarters of negative GDP growth is the standard definition of a recession -- a simple, clear, universally understood signal.
Positive correlation with outcomes. Higher GDP generally correlates with longer life expectancy, lower infant mortality, better infrastructure, higher literacy, and greater political freedom -- at least up to a certain income level.
Fiscal planning tool. Budget deficits, debt sustainability, tax revenue forecasts, and international aid allocation all rely on GDP as a baseline. The machinery of global finance depends on it.
Disadvantages
Ignores income distribution. GDP can be growing robustly while the gains flow entirely to the top. Without a distribution lens, GDP growth is a meaningless welfare statement.
Misses the informal economy. In many developing countries, 40-60% of real economic activity is informal and uncounted. GDP systematically underestimates these economies.
Counts destruction as growth. Natural disasters, environmental damage, crime, and war can all increase GDP through spending on cleanup, repairs, and reconstruction. This is a fundamental design flaw.
Ignores unpaid work. An estimated $10.8 trillion in annual unpaid care and household work (McKinsey) is invisible to GDP -- systematically undervaluing work done by women, volunteers, and communities.
Cannot measure wellbeing, happiness, or sustainability. GDP says nothing about whether people are healthy, happy, educated, secure, or whether economic gains are sustainable for future generations.
Fails to capture the digital economy. Trillions of dollars in consumer value from free digital services, open-source software, and information commons are essentially invisible to GDP measurement.
Blind to resource depletion. Extracting and selling natural resources counts as income in GDP, but the depletion of the underlying asset -- the resource itself -- is not recorded as a cost.
| Dimension | GDP Strength | GDP Weakness | Better Alternative |
| Economic Output | Excellent measurement | Conflates all output regardless of social value | Genuine Progress Indicator |
| Human Wellbeing | Weak correlation at high incomes | Does not measure wellbeing at all | Human Development Index, GNH |
| Inequality | None | Completely blind to distribution | Gini Coefficient, Palma Ratio |
| Environment | Counts env. spending as growth | Does not deduct environmental damage | Genuine Progress Indicator, Natural Capital accounting |
| Poverty | Broad income proxy | Misses multidimensional poverty | Multidimensional Poverty Index |
| Happiness | Weak below $75K per capita | No relationship above threshold | World Happiness Report, GNH |
| Digital Economy | Counts paid services | Misses free digital value | Consumer surplus measures, MIT digital economy estimates |
| Informal Economy | Partial estimates | Large undercount in developing countries | Survey-based estimates, satellite data |
Note: This comparison is a simplified framework. Each metric has its own detailed methodology. The 'Better Alternative' column indicates supplementary measures, not replacements.
The Future of Measuring Progress
"What we measure affects what we do. If our measurements are flawed, decisions may be distorted." -- Joseph Stiglitz, Nobel Prize in Economics
Stiglitz wrote those words in the context of the 2008 global financial crisis -- a crisis that GDP figures had spectacularly failed to predict or prevent. The measurement problem is not academic. It has consequences.
So what does the future of measuring progress look like? Several converging developments are reshaping the answer.
Artificial intelligence and big data are beginning to unlock measurement possibilities that were unimaginable even a decade ago. Satellite imagery can now track poverty levels in real time by measuring light emissions, building quality, and agricultural patterns. Mobile phone data can estimate population movement, economic activity, and access to services without waiting for census data. Social media sentiment analysis can provide crude but rapid readings of population mood.
The 'dashboard' approach is emerging as the most likely future framework. Rather than replacing GDP with a single alternative metric, the consensus is building around presenting GDP alongside a set of complementary indicators -- the way a car dashboard shows not just speed but fuel level, engine temperature, and oil pressure simultaneously. No single gauge tells the whole story. Together, they give the driver the information needed to navigate safely.
The OECD Better Life Index functions as an early prototype of this dashboard approach. Its 11 dimensions of wellbeing, tracked across 40+ countries, give a far richer picture than GDP alone -- while remaining grounded in comparable, evidence-based data.
The United Nations Sustainable Development Goals (SDGs) represent the broadest international framework ever constructed for measuring development. Adopted by 193 nations in 2015, the SDGs set 17 goals and 169 specific targets covering poverty, health, education, gender equality, clean energy, climate action, reduced inequalities, and more. GDP appears in the framework -- but as one input among many, not as the organizing principle.
The philosophical shift underlying all of these developments is perhaps the most important: from asking 'How much are we producing?' to asking 'How well are we living?'
Production is a means. Wellbeing is the end. GDP has long been treated as both. The future of progress measurement is about separating those two things -- and holding governments accountable for the one that actually matters to human lives.
The tools are being built. The political will is emerging. The only question is how long it will take -- and how many people will be misled by incomplete scorecards in the meantime.
Conclusion -- Look Beyond the Numbers, See the People
Let us return to where we started: Kansas, 1968. Robert F. Kennedy had eighty days left to live. He stood before students and delivered a verdict that the economic establishment of the time received with polite dismissal.
"GDP measures everything except that which makes life worthwhile. It measures neither our wit nor our courage, neither our wisdom nor our learning, neither our compassion nor our devotion to our country. It measures everything, in short, except that which makes life worthwhile." -- Robert F. Kennedy, 1968
Half a century later, those words have become more relevant, not less. The world's GDP has grown by a factor of perhaps 30 since Kennedy spoke them. And yet the question he implicitly posed has still not been answered: are people actually living better?
The answer, as this article has shown, is complicated. In many ways, yes -- life expectancy is longer, extreme poverty has fallen, technology has provided comforts that would have seemed miraculous to earlier generations. GDP growth has played a role in those achievements.
But simultaneously: inequality has widened dramatically in most countries. The climate crisis -- largely produced by the same economic activity that GDP celebrates -- threatens the foundations of civilization. Mental health disorders have surged. Millions live in wealthy countries without access to basic healthcare. And 700 million people remain in extreme poverty despite GDP records being broken annually.
GDP is a useful tool. It is a dangerous master.
The next time you hear that a country's GDP grew by 7%, or that an economy is 'the world's third largest,' pause and ask the questions that GDP cannot answer:
Whose lives actually improved? Did the gains reach the people at the bottom, or were they captured at the top?
What were the environmental costs? Were forests cleared, rivers polluted, or carbon emissions increased to generate that growth?
How did inequality change? Did the Gini coefficient rise or fall? Are people more or less secure?
Is the growth sustainable? Is it funded by debt? Is it depleting natural resources that cannot be replaced?
"Not everything that counts can be counted, and not everything that can be counted counts." -- attributed to Albert Einstein
GDP tells you how big an economy is. It does not tell you how good it is. It tells you how fast production is growing. It does not tell you whether human beings are flourishing.
The most important economic question of the 21st century is not 'How do we grow GDP faster?' It is 'How do we build economies where more people live well -- in dignity, in health, with security and purpose -- without destroying the natural systems on which all of it depends?'
That is a question GDP was never designed to answer. It is time to build the tools that can.
Recommended for you
Accounting: The Language of Business
Accounting is like a notebook for a business where all the money-related activities are recorded and tracked. Just like students track their exam scores to understand how they are doing, businesses use accounting to see if they are making a profit or loss. It acts like the financial backbone of a company. Accountants organize these records into different sections to make things easier to understand. To show their performance to shareholders, companies prepare documents called financial statements.
Banking
Banking: What It Is, How Banks Work, and Everything You Need to Know
Money
Money: What It Is, How It Works, and Its Complete History

Business
Needs, Wants, and Demands

Books
The $100 Startup
Business Law
Business Law: What It Is, Why It Matters, and Types You Must Know

Canvas & Methods
Minimum Viable Product (MVP): The Smart Way to Launch Your Business With Less Risk

Crime and Fraud
Ponzi Scheme: The Investment Fraud That Has Been Fooling People for Over 100 Years

Marketing
Digital Marketing: What It Is, Why It Matters, and How It Works

Startup
How to Calculate Startup Valuation: Methods, Tools, and Examples
